


Depending on the vulnerability and resilience of a household or district, the optimal quantum of fiscal support can potentially be fine-tuned
Tighten the seatbelts
The year 2001 saw the release of a gripping war movie, Enemy at the Gates. Inspired by true events and set against the backdrop of the Battle of Stalingrad during the Second World War, it is a story of two skilful snipers who are grittily engaged in a personal battle to hunt each other down.
The rules of this battle are simple: one sloppy moment by any of the two and a bullet gets pierced through the head. Eventually, the sniper who comes out alive from the contest is the one who makes one mistake less than the other.
The movie is a riveting story of unfaltering human survival spirit labouring against the unknown enemy and deftly navigating through the precarious territory while biding time through drawing upon the apparently limitless stacks of human patience.
The movie may be two decades old, but the message is still fresh and sharp: In the battle of unknowns, resilience will ultimately triumph over vulnerability. Now, there is a similar war we are engaged in at this moment and this time around, the enemy is an invisible virus, hideous and lethal. Be that as it may, we do know that like any other battle, the winning mantra is simple: minimise vulnerability, maximise resilience. But what exactly is vulnerability and resilience in this war with the virus?
Now, what originated as a health crisis, is soon beginning to metamorphose into an economic crisis. While the lockdown policy is a potent strategy to contain the spread of the virus, every additional week of lockdown means lost output and income, which is not going to come back. Besides, even when the lockdown is entirely lifted, the economy after the pandemic is likely to be very different. Economic activities are likely to get restructured and redesigned to observe norms such as social distancing. And when all this chaos plays out, some jobs will be lost, income and sales will dip and prices will soar. All in all, we are looking at an economic shock of the magnitude we have never witnessed before, and this brings us back to the question of our weakness and strengths – our financial vulnerability and resilience - in the face of such an adverse economic shock.
Vulnerability and Resilience
Vulnerability can be interpreted as the extent of (financial) exposure to an adverse economic shock and resilience is the capacity to weather such a shock. Indian economy is ultimately an aggregation of the miniature economies of the families. Tolstoy once famously quipped “all happy families are alike; every unhappy family is unhappy in its own way”. A paraphrased version in accounting terms would mean that the balance sheet and income-expenditure statement of every household is different.
Households which earn income through wages, remittance, business profit and agricultural income are more exposed to macroeconomic shocks than households which get income from relatively stable sources such as pension. Also, households which exhaust a major portion of income on just essential items like cereals, vegetables and rice are more precariously positioned.
Faced with a shock to income, the natural response of any household would be to lean on savings, especially the raw cash. But households also differ in their savings behaviour and borrowing needs. Households which save in liquid assets like gold can convert their gold assets to cash more swiftly than those which hold an asset with a significant lock-in period such as the provident fund. Similarly, a household which has to borrow for food and medical expenditure signals a relatively more precarious financial position than one that borrows for a standard reason like education or home.
Given all these varied characteristics of the millions of the Indian households, how can we arrive at a quantified summary of these differences? Using CMIE Consumer Pyramids survey data, I create a metric of vulnerability and resilience of households, by analysing the (wage) income, (consumption) expenditure, (liquid) assets and (short-term) liabilities of the households. (Details in the research paper here).
I then aggregate these charactersitics of households at the level of districts. The analysis (Figure 1) at the level of districts suggests that about 49 districts are the most robust – with low vulnerability and high resilience. On the other extreme, about 57 districts are the most fragile, with high vulnerability and low resilience. And some 62 districts fall in the region of medium vulnerability and resilience.
Figure 1
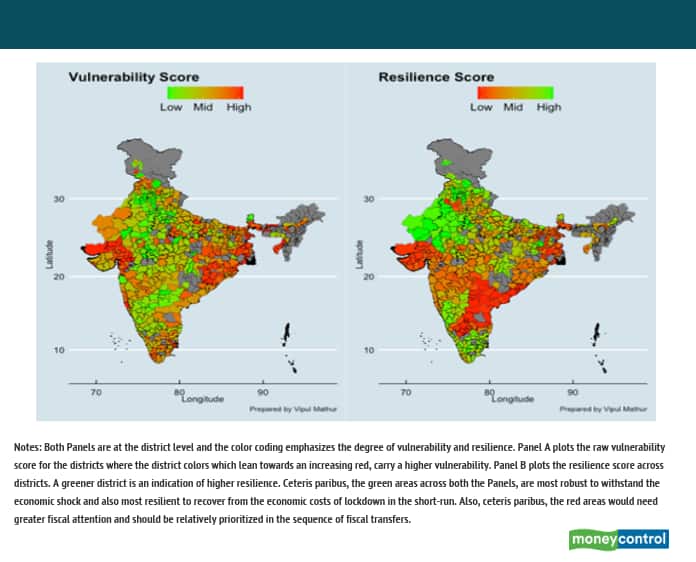
Notes: Both panels are at the district level and the colour coding emphasizes the degree of vulnerability and resilience. Panel A plots the raw vulnerability score for the districts where the district colours which lean towards an increasing red carry a higher vulnerability. Panel B plots the resilience score across districts. A greener district is an indication of higher resilience. Other things being equal, the green areas across both the panels are most robust to withstand the economic shock and also most resilient to recover from the economic costs of lockdown in the short run. Also, other conditions staying constant, the red areas would need greater fiscal attention and should be relatively prioritised in the sequence of fiscal transfers.
I also segregate the cross-section of households along the dimensions of vulnerability and resilience. At the level of households (Figure 2), the analysis suggests that around 14.4 percent of the households are the most robust with low-mid vulnerability and mid-high resilience. On the other hand, about 48.4 percent of the households are the most fragile, falling in high-mid vulnerability region with low-mid resilience. About 37.2 percent households fall in between the two extremes and have a mixed exposure with muddled resilience.
Figure 2
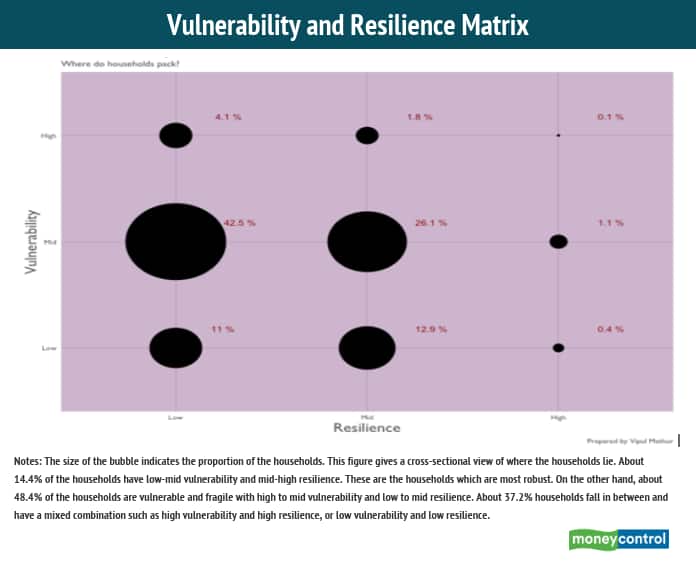
Notes: The size of the bubble indicates the proportion of the households. This figure gives a cross-sectional view of where the households lie. About 14.4 percent of the households have low-mid vulnerability and mid-high resilience. These are the households which are most robust. On the other hand, about 48.4 percent of the households are vulnerable and fragile with high to mid vulnerability and low to mid resilience. About 37.2 percent households fall in between and have a mixed combination such as high vulnerability and high resilience, or low vulnerability and low resilience.
Fiscal Bullet in a Pandemic
Where does this analysis take us? It takes us right to the centre of the burning question of the day: how to conduct fiscal policy in a pandemic? Now, the fiscal budget is a limited resource and it doesn’t come cheap. The question to ask is, if the government has a budget of thousand rupees, how does it optimally distribute it in the economy? Specifically, who gets how much and when? For a heterogeneous economy like India, the question of distribution is particularly a question of both the sequence and the quantum. And this is where a snapshot identification of vulnerability and resilience can guide the policy by chartering out the sequencing path and the magnitude of such fiscal transfers.
For instance, in the order of sequence, the fiscal support will be most productive for households or districts which rank the highest on vulnerability and lowest on resilience. These are pockets which would need immediate attention. Pockets which are more robust, such as those with high resilience and low vulnerability, can perhaps be sequenced a little lower in the order.
Second, depending upon the vulnerability and resilience of a household or district, the optimal quantum of fiscal support can potentially be fine-tuned across the households. To be most effective, the amount of household or district level fiscal transfers could be made conditional on the extent of exposure and capacity of a household or district to weather the economic shock. Pockets with high vulnerability and low resilience could receive a larger share than those with low vulnerability and high resilience.
Third, households or districts which have higher contact intensity (refer to the work ‘Economic Contact Intensity Index for India’) will be hit hardest and therefore, may need more immediate fiscal attention.
Unlike in the movie, the bullets in the fiscal rifle are finite and in short supply. The telescope of vulnerability and resilience can be mounted on the rifle for the judicious use of the fiscal bullet and neutralise the enemy, only this time the deadly virus.
Additional Figures
I also consider two hypothetical scenarios, where I consider an aggregate shock to employment and prices to determine the impact at the margin. The analysis suggests that upon a 10 percent and 25 percent shock, approximately 23 million and 75 million individuals may find themselves at the margin of financial distress, respectively.
How plausible are these scenarios? A back of the envelope calculation suggests that every week that the economy is kept (completely) shut, it causes an aggregate annualised shock of 1.9 percent (1/52 percent). A six weeks of lockdown is equivalent to an 11.54 percent shock on aggregate income. So yes, a 10 percent aggregate shock - which is a combination of income and price shock - is entirely plausible. While a 25 percent shock is an extreme view at this moment, but to the extent that the lockdown or social distancing measures impede the economic activities moving forward, it may not be beyond approach.
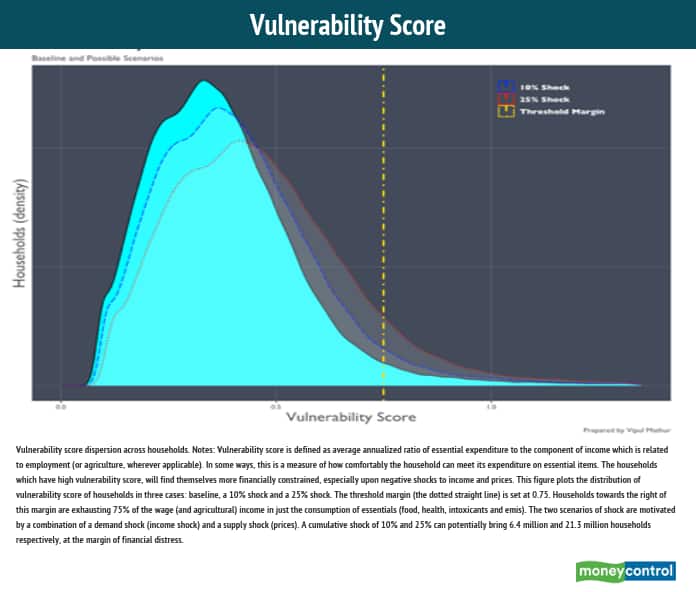
Notes: Vulnerability score is defined as average annualized ratio of essential expenditure to the component of income which is related to employment (or agriculture, wherever applicable).
In some ways, this is a measure of how comfortably the household can meet its expenditure on essential items. The households which have high vulnerability score will find themselves more financially constrained, especially upon negative shocks to income and prices. This figure plots the distribution of vulnerability score of households in three cases: baseline, a 10 percent shock and a 25 percent shock.
The threshold margin (the dotted straight line) is set at 0.75. Households towards the right of this margin are exhausting 75 percent of the wage (and agricultural) income in just the consumption of essentials (food, health, intoxicants and EMIs). The two scenarios of shock are motivated by a combination of a demand shock (income shock) and a supply shock (prices). A cumulative shock of 10 percent and 25 percent can potentially bring 6.4 million and 21.3 million households, respectively, at the margin of financial distress.
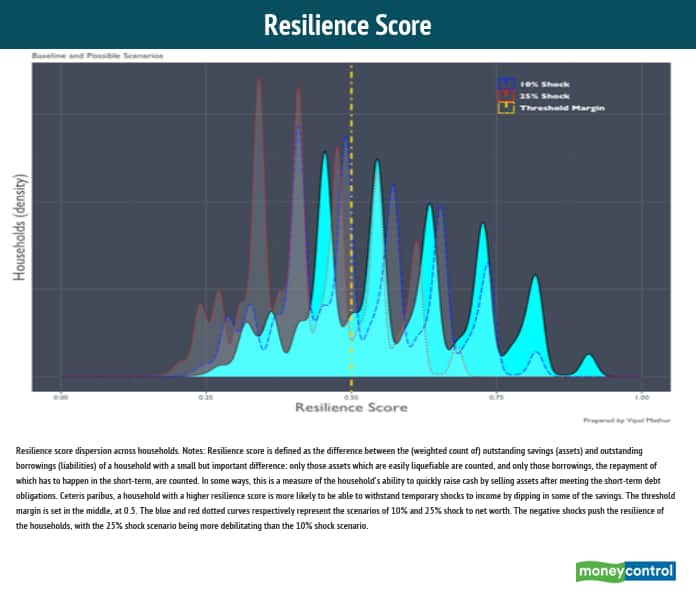
Notes: Resilience score is defined as the difference between the (weighted count of) outstanding savings (assets) and outstanding borrowings (liabilities) of a household. There is a small but important difference: only those assets which are easily liquefiable are counted, and only those borrowings the repayment of which has to happen in the short term are counted.
In some ways, this is a measure of the household's ability to quickly raise cash by selling assets after meeting the short-term debt obligations. Other things remaining the same, a household with a higher resilience score is more likely to be able to withstand temporary shocks to income by dipping into some of the savings. The threshold margin is set in the middle, at 0.5. The blue and red dotted curves, respectively, represent the scenarios of 10 percent and 25 percent shock to net worth. The negative shocks push the resilience of the households, with the 25 percent shock scenario being more debilitating than the 10 percent shock scenario.
This is an abridged take on the research paper which is available here:https://papers.ssrn.com/sol3/papers.cfm?abstract_id=3590135(Vipul Mathur is Faculty, Economics, IIM-Calcutta. Views are personal.)
Moneycontrol Virtual Summit presents 'The Future of Indian Industry', powered by Salesforce
Register Now! and watch industry stalwarts forecast how India Inc will shape up in post COVID-19 world
Date: May 19


