


One can understand that the major lows formed on Nifty have been most of the time on this 70-day cycle with minor deviations only on a few occasions.

Ashish Kyal, CMT
Time cycles is an important concept in technical analysis that helps in capturing important lows. The 70-Day Time cycle has been working well for the Nifty index in capturing lows. The next cycle low will by the week of July.
Nifty daily chart with Time cycles

Nifty 70-Day Time cycle:
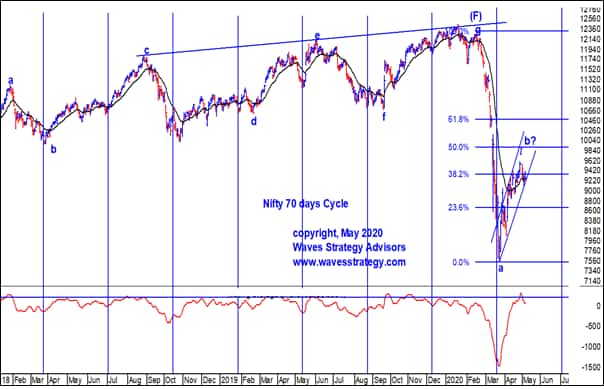
We have been trying to search for a cycle that overlapped with the low formed on March 24, 2020, near 7,511 levels. This resulted in a 70-Day cycle. This is not as per Hurst’s Time cycle method, nevertheless, is proving out to be capturing important lows.
One can understand that the major lows formed on Nifty have been most of the time on this 70-day cycle with minor deviations only on a few occasions. The next low as per this cycle is near the first week of July.
We have already consumed 28 days in this cycle which on average tops out around 35 days. Moving average difference indicators shown at the bottom of the chart clearly provide cyclicality behaviour and also highlights the overbought zone.
The same indicator is now turning back below zero which means the shorter moving average is crossing back below the bigger average and is entering into the 'sell' cycle. Let's see if the crucial support level can remain protected on a weekly closing basis.
Neo wave pattern:
Glenn Neely identified new patterns developing in financial markets and Diametric - a seven-legged corrective pattern - is one of them.
The Nifty completed wave 'g' of (F) at the top and since then the primary degree wave (G) has started on the downside. This wave (G) is further divided into corrective patterns as shown in the chart above.
More price action is required to confirm if wave 'b' of G is still ongoing or not. We continue to be in a Bear market rally and post its completion the next set of downside trends will start.
Elliott wave helps to understand the overall maturity of the trend along with the price forecasting ability and Time cycles provide time forecasting ability.
Both Time cycles and Elliott wave – Neo wave suggest that it is going to take many more months of correction before we see the next Bull trend in the market.
The correction can be in terms of time or price and we are keeping a close watch on these advanced Technical analysis methods for deriving prudent trade setup with appropriate risk-reward.
(The author is CEO Waves Strategy Advisors. He could be reached on Twitter at @kyalashish)
Disclaimer: The views and investment tips expressed by experts on Moneycontrol.com are their own and not those of the website or its management. Moneycontrol.com advises users to check with certified experts before taking any investment decisions.Special Offer: Subscribe to Moneycontrol PRO’s annual plan for ₹1/- per day for the first year and claim exclusive benefits worth ₹20,000. Coupon code: PRO365


