 The aggregate picture that emerged was simple: Pulses consumption in India is showing signs of flattening. (Representational Image)
Is there stagnation in demand for pulses, milk and other protein-rich foods in India? The National Statistical Office (NSO) withheld its household consumption expenditure survey report for 2017-18 but alternative data sources do suggest a slowdown — at least in respect of the ubiquitous dal and doodh.
At a global Pulses Conclave held earlier this month in Pune, the overwhelming concern expressed by participants was: Why are we not eating enough pulses?
One of the presentations at the event was a detailed analysis of the estimated consumption of individual pulses — chana (chickpea), yellow peas, masur (red lentil), arhar (pigeon-pea), moong (green gram) and urad (black gram) — based on year-wise opening stocks plus domestic production and imports, and deducting exports, diversion towards seed and feed, and closing stocks.
The aggregate picture that emerged was simple: Pulses consumption in India is showing signs of flattening.
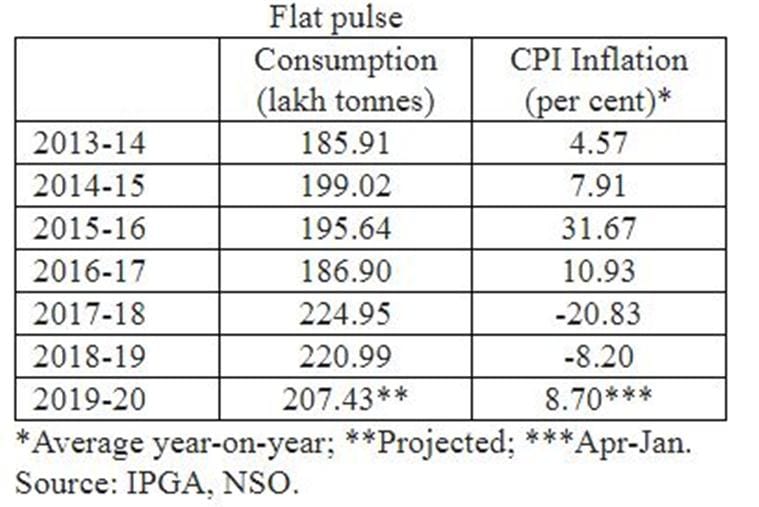
Between 2013-14 and 2017-18, it rose from 18.6 million tonnes (mt) to 22.5 mt, but fell to 22.1 mt in 2018-19 and is projected to further decline to 20.7 mt this year. Some of that may be attributable to prices. Thus, 2015-16 and 2016-17 recorded a consumption drop alongside double-digit dal inflation. The peak consumption in 2017-18 was when prices actually dipped 20.8 per cent year-on-year. The link between consumption and inflation, however, breaks down from 2018-19 (see table).
Saurabh Bhartia of the Indian Pulses and Grains Association (IPGA) — the apex organisation of dal millers, traders, exporters and importers that drew up the estimates — is convinced that the apparent demand slowdown is real.
“We need a National Egg Coordination Committee-like body for pulses to push consumption. The campaign they launched in the 1980s helped in positioning egg as a wholesome nutrition food. The time has come for a similar sustained drive promoting pulses as an excellent source of protein, micronutrients and fibre that is also low-fat and cholesterol-free,” he says.
Nitin Kalantri, a leading dal trader and processor from Latur in Maharashtra, traces the low growth in pulses consumption to 2015-16, when retail prices of arhar dal breached the Rs 200/kg level.
Linked to income
With rising income, the consumption of milk, pulses, eggs and meat had increased, especially among the poor. Flattening demand growth for protein-rich foods suggests incomes aren’t rising as before. But whether consumption is actually slowing will be known only from the next NSO household survey.
“From then, somehow a perception gained ground that pulses are expensive. Around the same time, vegetables also turned relatively cheap and consumers started having more of them in place of dal. 2017-18 was a one-off year when consumption rose on the back of a price crash, but the memories of Rs 200/kg haven’t gone from people’s minds,” he points out.
Agreeing with Bhartia, Kalantri says: “Egg has benefitted from branding, which is lacking in pulses. Moreover, you can eat it by simply boiling, unlike dal that requires seasoning and making chhonk (tempering)”.
But it isn’t pulses alone. Data from successive annual reports of the National Dairy Development Board shows that total liquid milk marketing by cooperatives — they account for the bulk of sales in this segment — has gone up from 201.03 lakh litres per day (LLPD) in 2008-09 to 294.44 LLPD in 2013-14. In 2018-19, this figure reached just 354.53 LLPD.
In other words, a compound annual growth rate (CAGR), amounting to 7.9 per cent during 2008-09 to 2013-14, has plunged to 3.8 per cent in the last five years.
What makes this trend particularly striking — even the absolute increase in milk sales from 2013-14 to 2018-19 (60.09 LLPD) was hardly two-thirds of the earlier five years (93.41 LLPD) — is that it has occurred despite lower inflation. Between 2008-09 and 2013-14, prices of full-cream milk (containing 6 per cent fat and 9 per cent solids-not-fat) in Delhi rose from about Rs 24 to Rs 46 per litre. In the subsequent five years till March 2019, the jump was only to Rs 52 per litre.
Equally interesting is that the deceleration in milk sales has taken place when India’s production went up from 137.7 mt in 2013-14 to 187.7 mt in 2018-19, according to Department of Animal Husbandry & Dairying (DAHD) statistics. That translated into a CAGR of 6.4 per cent, as against 4.2 per cent for the five years from 2008-09, when the estimated output was 112.2 mt.
Veteran agriculture economist Ashok Gulati feels the stagnant consumption trend in both milk and pulses is largely due to incomes, which aren’t rising as before. This is especially for the poorer sections, whose spending on protein-rich “superior” foods tends to increase even more with higher incomes.
The best indicator here is rural wages. The average annual growth of wages in rural India during 2014-15 to 2018-19 was only 5.3 per cent in nominal terms and 0.6 per cent after adjusting for consumer inflation of 4.7 per cent. In the preceding five-year period, nominal rural wage growth averaged 17.6 per cent and 6.8 per cent annually in real terms.
A better idea of what’s happening to demand can, perhaps, be obtained only from the NSO’s next household consumption expenditure survey from July 2020 to June 2021.
The last published report for 2011-12 had revealed daily per capita consumption of milk and dairy products to have risen since 2004-05 more sharply in rural (from 128.87 ml to 144.43 ml) than in urban India (170.23 ml to 180.73 ml).
Significantly, these survey-based consumption figures were way below the DAHD’s per capita daily milk availability estimate of 290 gram (282 ml) for 2011-12, which went up to 394 gram (383 ml) in 2018-19. Whether the gap between the DAHD’s production and NSO’s consumption numbers has further widened will be known only after the latter’s next survey.
For now, what’s clear is this: Food has become more affordable in the last five years, as the Finance Ministry’s recent Economic Survey chapter on “Thalinomics” has shown. But whether Indians are consuming more, as a result, isn’t clear.