
Check the latest opinion poll trends with the poll tracker, which measures how people say they are going to vote at the next general election.
Party support: 20 September 2019
Analysis by BBC senior political analyst Peter Barnes
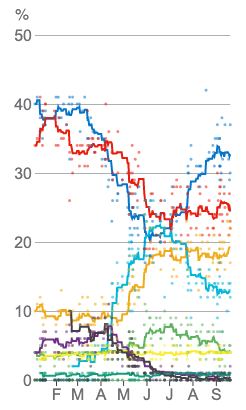
As our poll tracker graph shows, after a year and a half of only gradual movement, the period since February has been pretty tumultuous - perhaps reflecting what has been going on in politics.
The creation of the new Change UK Party - since renamed The Independent Group for Change (or TIGfC in our chart) - and then The Brexit Party had a major impact.
Added to this has been a sustained increase in support for the Liberal Democrats and a clear boost for the Conservatives after Boris Johnson replaced Theresa May as prime minister in July.
That is just the picture in Britain-wide polls. In Scotland, we have less evidence to go on, but it seems as though the political drama has resulted in a rise in support for the SNP, as well as the Lib Dems, at the expense of the Conservatives and Labour.
Conference bounce?
Polls over the last week have been good for the Liberal Democrats, even taking into account the strong year they've had. The party seems to be a few points higher now than it was at the start of the month.
They will hope that the improvement is a consequence of their new policy on Brexit - a promise to revoke Article 50 if they win a majority at the next general election.
However, it could just be a conference bounce.
It is fairly common during party conference season for each party to see their numbers boosted immediately after their turn in the sun. Often though, this fades away within a couple of weeks and things go back to roughly where they were before.
We will have to wait and see if that happens this time.
Mind the gap
It is always important to treat polling figures with caution, but at the moment there is an additional reason for concern: more variation between the different polling companies than normal.
This month, there have been cases where two polls published on the same day have wildly different figures - for example, the Conservatives on 28% in one poll, but 37% in another.
Clearly, in an election those two different vote shares would mean dramatically different outcomes in terms of the make-up of the House of Commons. So any attempt to read off from current polls to the expected election result would be foolhardy.
Nobody really knows why the variation is so large. Some of it is probably down to differences between how each company analyses their raw polling data, but it's hard to see how that can be the whole story given the size of the gaps.
Out of 100 people who are likely to vote, about...
- 32 say they will vote CON , But it could be between 28-36
- 24 say they will vote LAB , But it could be between 20-28
- 19 say they will vote LD , But it could be between 15-23
- 12 say they will vote BRX , But it could be between 8-16
- 4 say they will vote GRN , But it could be between 0-8
- 3 say they will vote SNP
- 0 say they will vote UKIP , But it could be between 0-4
- 0 say they will vote PC
- 0 say they will vote TIGfC , But it could be between 0-4
Please upgrade your browser or enable JavaScript to see the full interactive experience
Of 100
Please select a demographic group for its voting intention datawho are likely to vote, about...
Of 100 people who are likely to vote, about...Out of 100 people who are likely to vote, about...
There's about a 90% chance that the true support for each party lies within the ranges shown above, which means there's a one in 10 chance that it lies outside these ranges.
* Because the SNP and Plaid Cymru only campaign in Scotland and Wales respectively, the margins of error for their support across Great Britain is likely to be less than +/- 1%
Full polling data
Scroll vertically or horizontally to see more polling data Scroll table to see more polling data| Date, Pollster and Sample Date Pollster Sample | ConservativesCON | LabourLAB | Lib DemsLD | Brexit PartyBRX | GreenGRN | SNPSNP | UKIPUKIP | Plaid CymruPC | The Independent Group for ChangeTIGfC |
|---|---|---|---|---|---|---|---|---|---|
| 20 September 2019, YouGov and Sample size: 2,006 20 Sep 2019 YouGov 2,006 | 30 | 23 | 22 | 14 | 5 | 4 | 0 | 0 | 0 |
| 20 September 2019, Opinium and Sample size: 2,004 20 Sep 2019 Opinium 2,004 | 37 | 22 | 17 | 12 | 4 | 4 | 2 | 1 | 0 |
| 19 September 2019, ComRes and Sample size: 2,050 19 Sep 2019 ComRes 2,050 | 29 | 27 | 21 | 13 | 5 | 4 | No data available- | No data available- | 1 |
| 18 September 2019, YouGov and Sample size: 1,608 18 Sep 2019 YouGov 1,608 | 32 | 21 | 23 | 14 | 4 | 4 | 1 | 1 | 0 |
| 16 September 2019, Ipsos Mori and Sample size: 1,006 16 Sep 2019 Ipsos Mori 1,006 | 33 | 24 | 23 | 10 | 4 | 4 | 0 | 0 | 0 |
| 13 September 2019, Opinium and Sample size: 2,002 13 Sep 2019 Opinium 2,002 | 37 | 25 | 16 | 13 | 2 | 4 | 1 | 1 | 0 |
| 12 September 2019, ComRes and Sample size: 2,057 12 Sep 2019 ComRes 2,057 | 28 | 27 | 20 | 13 | 5 | 4 | 1 | 1 | 1 |
| 10 September 2019, YouGov and Sample size: 1,619 10 Sep 2019 YouGov 1,619 | 32 | 23 | 19 | 14 | 7 | 4 | 0 | 0 | 0 |
| 9 September 2019, Kantar and Sample size: 1,144 9 Sep 2019 Kantar 1,144 | 38 | 24 | 20 | 7 | 3 | 4 | 1 | 1 | 1 |
| 8 September 2019, ComRes and Sample size: 2,016 8 Sep 2019 ComRes 2,016 | 30 | 29 | 17 | 13 | 4 | 3 | 1 | 1 | No data available- |
| 7 September 2019, Deltapoll and Sample size: 2,049 7 Sep 2019 Deltapoll 2,049 | 31 | 28 | 17 | 13 | 4 | 5 | 1 | 0 | No data available- |
| 6 September 2019, YouGov and Sample size: 1,676 6 Sep 2019 YouGov 1,676 | 35 | 21 | 19 | 12 | 7 | 4 | 0 | 0 | 0 |
| 6 September 2019, Panelbase and Sample size: 1,013 6 Sep 2019 Panelbase 1,013 | 31 | 28 | 19 | 15 | 2 | 3 | 0 | 0 | 0 |
| 6 September 2019, Survation and Sample size: 1,006 6 Sep 2019 Survation 1,006 | 29 | 24 | 18 | 17 | 3 | 4 | No data available- | No data available- | No data available- |
| 6 September 2019, ComRes and Sample size: 2,009 6 Sep 2019 ComRes 2,009 | 31 | 27 | 20 | 13 | 3 | 3 | 1 | 1 | 0 |
| 6 September 2019, Opinium and Sample size: 2,009 6 Sep 2019 Opinium 2,009 | 35 | 25 | 17 | 13 | 3 | 5 | 1 | 0 | 0 |
| 4 September 2019, Hanbury and Sample size: 995 4 Sep 2019 Hanbury 995 | 33 | 26 | 17 | 14 | 3 | 4 | 0 | 1 | 0 |
| 3 September 2019, YouGov and Sample size: 1,639 3 Sep 2019 YouGov 1,639 | 35 | 25 | 16 | 11 | 7 | 4 | 1 | 1 | 0 |
| 3 September 2019, ICM and Sample size: 2,041 3 Sep 2019 ICM 2,041 | 37 | 30 | 16 | 9 | 4 | 3 | 1 | 1 | No data available- |
| 31 August 2019, Deltapoll and Sample size: 2,028 31 Aug 2019 Deltapoll 2,028 | 35 | 24 | 18 | 14 | 4 | 4 | 0 | 1 | 1 |
| 30 August 2019, Survation and Sample size: 1,020 30 Aug 2019 Survation 1,020 | 31 | 24 | 21 | 14 | 3 | 4 | No data available- | 1 | No data available- |
| 29 August 2019, YouGov and Sample size: 1,867 29 Aug 2019 YouGov 1,867 | 33 | 22 | 21 | 12 | 7 | 4 | 0 | 1 | 0 |
| 28 August 2019, YouGov and Sample size: 2,006 28 Aug 2019 YouGov 2,006 | 34 | 22 | 17 | 13 | 8 | 4 | 1 | 1 | 0 |
| 23 August 2019, YouGov and Sample size: 2,019 23 Aug 2019 YouGov 2,019 | 33 | 21 | 19 | 14 | 7 | 4 | 0 | 1 | 0 |
| 23 August 2019, Opinium and Sample size: 2,005 23 Aug 2019 Opinium 2,005 | 32 | 26 | 15 | 16 | 4 | 5 | 1 | 1 | No data available- |
| 21 August 2019, YouGov and Sample size: 1,687 21 Aug 2019 YouGov 1,687 | 32 | 22 | 20 | 12 | 7 | 4 | 0 | 1 | 0 |
| 19 August 2019, Kantar and Sample size: 1,133 19 Aug 2019 Kantar 1,133 | 42 | 28 | 15 | 5 | 3 | 5 | 0 | 0 | 1 |
| 14 August 2019, YouGov and Sample size: 1,625 14 Aug 2019 YouGov 1,625 | 30 | 21 | 20 | 14 | 8 | 4 | 1 | 1 | 0 |
| 12 August 2019, BMG and Sample size: 1,515 12 Aug 2019 BMG 1,515 | 31 | 25 | 19 | 12 | 7 | 3 | 1 | 1 | 0 |
| 11 August 2019, ComRes and Sample size: 2,011 11 Aug 2019 ComRes 2,011 | 31 | 27 | 16 | 16 | 4 | 3 | 1 | No data available- | No data available- |
| 11 August 2019, Survation and Sample size: 2,040 11 Aug 2019 Survation 2,040 | 28 | 24 | 21 | 15 | 3 | 4 | No data available- | 0 | No data available- |
| 9 August 2019, Opinium and Sample size: 2,003 9 Aug 2019 Opinium 2,003 | 31 | 28 | 13 | 16 | 5 | 4 | 1 | 1 | 0 |
| 6 August 2019, YouGov and Sample size: 1,628 6 Aug 2019 YouGov 1,628 | 31 | 22 | 21 | 14 | 7 | 4 | 0 | 0 | 0 |
| 30 July 2019, YouGov and Sample size: 2,066 30 Jul 2019 YouGov 2,066 | 32 | 22 | 19 | 13 | 8 | 4 | 0 | 1 | 0 |
| 30 July 2019, Ipsos Mori and Sample size: 1,007 30 Jul 2019 Ipsos Mori 1,007 | 34 | 24 | 20 | 9 | 6 | 5 | 1 | 1 | 0 |
| 27 July 2019, Deltapoll and Sample size: 2,001 27 Jul 2019 Deltapoll 2,001 | 30 | 25 | 18 | 14 | 4 | 4 | 1 | 1 | 2 |
| 26 July 2019, YouGov and Sample size: 1,697 26 Jul 2019 YouGov 1,697 | 31 | 21 | 20 | 13 | 8 | 5 | 0 | 1 | 0 |
| 26 July 2019, Opinium and Sample size: 2,006 26 Jul 2019 Opinium 2,006 | 30 | 28 | 16 | 15 | 5 | 5 | 1 | 1 | 0 |
| 25 July 2019, ComRes and Sample size: 2,029 25 Jul 2019 ComRes 2,029 | 28 | 27 | 19 | 16 | 4 | 3 | 1 | No data available- | No data available- |
| 24 July 2019, YouGov and Sample size: 1,715 24 Jul 2019 YouGov 1,715 | 25 | 19 | 23 | 17 | 9 | 4 | 1 | 1 | 0 |
| 17 July 2019, YouGov and Sample size: 1,749 17 Jul 2019 YouGov 1,749 | 25 | 21 | 20 | 19 | 8 | 4 | 0 | 1 | 0 |
| 16 July 2019, ComRes and Sample size: 2,038 16 Jul 2019 ComRes 2,038 | 25 | 28 | 17 | 19 | 5 | 4 | 1 | No data available- | No data available- |
| 11 July 2019, ComRes and Sample size: 2,025 11 Jul 2019 ComRes 2,025 | 24 | 28 | 15 | 20 | 5 | 3 | 1 | No data available- | No data available- |
| 11 July 2019, Survation and Sample size: 1,012 11 Jul 2019 Survation 1,012 | 23 | 29 | 19 | 20 | 3 | 4 | No data available- | 1 | No data available- |
| 10 July 2019, YouGov and Sample size: 1,671 10 Jul 2019 YouGov 1,671 | 24 | 20 | 19 | 21 | 9 | 5 | 0 | 1 | 0 |
| 7 July 2019, ComRes and Sample size: 2,010 7 Jul 2019 ComRes 2,010 | 25 | 28 | 16 | 19 | 5 | 3 | 1 | No data available- | 0 |
| 5 July 2019, Opinium and Sample size: 2,002 5 Jul 2019 Opinium 2,002 | 23 | 25 | 15 | 22 | 8 | 5 | 1 | 1 | 1 |
| 5 July 2019, BMG and Sample size: 1,532 5 Jul 2019 BMG 1,532 | 28 | 27 | 18 | 14 | 6 | 2 | 2 | 1 | 1 |
| 3 July 2019, YouGov and Sample size: 1,605 3 Jul 2019 YouGov 1,605 | 24 | 18 | 20 | 23 | 9 | 4 | 0 | 1 | 0 |
| 25 June 2019, YouGov and Sample size: 2,059 25 Jun 2019 YouGov 2,059 | 22 | 20 | 19 | 22 | 10 | 4 | 1 | 1 | 0 |
| 25 June 2019, Ipsos Mori and Sample size: 1,043 25 Jun 2019 Ipsos Mori 1,043 | 26 | 24 | 22 | 12 | 8 | 5 | 1 | No data available- | 0 |
| 20 June 2019, Opinium and Sample size: 2,009 20 Jun 2019 Opinium 2,009 | 20 | 26 | 16 | 23 | 6 | 4 | 2 | 1 | 1 |
| 20 June 2019, Survation and Sample size: 2,016 20 Jun 2019 Survation 2,016 | 24 | 26 | 18 | 20 | 6 | 3 | 1 | 1 | 1 |
| 19 June 2019, YouGov and Sample size: 1,641 19 Jun 2019 YouGov 1,641 | 20 | 20 | 21 | 23 | 9 | 4 | 1 | 1 | 0 |
| 14 June 2019, YouGov and Sample size: 1,672 14 Jun 2019 YouGov 1,672 | 21 | 21 | 19 | 24 | 9 | 3 | 0 | 1 | 0 |
| 10 June 2019, YouGov and Sample size: 1,702 10 Jun 2019 YouGov 1,702 | 17 | 19 | 22 | 26 | 8 | 4 | 0 | 1 | 1 |
| 9 June 2019, ComRes and Sample size: 2,017 9 Jun 2019 ComRes 2,017 | 23 | 27 | 17 | 22 | 5 | 3 | 1 | 1 | 1 |
| 7 June 2019, BMG and Sample size: 1,520 7 Jun 2019 BMG 1,520 | 26 | 27 | 17 | 18 | 6 | 3 | 1 | 1 | 1 |
| 6 June 2019, YouGov and Sample size: 1,670 6 Jun 2019 YouGov 1,670 | 18 | 20 | 20 | 26 | 9 | 5 | 1 | 0 | 0 |
| 5 June 2019, YouGov and Sample size: 1,663 5 Jun 2019 YouGov 1,663 | 18 | 19 | 22 | 25 | 9 | 4 | No data available- | 0 | No data available- |
| 1 June 2019, YouGov and Sample size: 1,644 1 Jun 2019 YouGov 1,644 | 18 | 19 | 23 | 23 | 10 | 5 | No data available- | 0 | No data available- |
| 30 May 2019, Deltapoll and Sample size: 2,449 30 May 2019 Deltapoll 2,449 | 20 | 26 | 16 | 24 | 5 | 4 | 1 | 1 | 4 |
| 30 May 2019, Opinium and Sample size: 2,005 30 May 2019 Opinium 2,005 | 17 | 22 | 16 | 26 | 11 | 4 | 1 | 1 | 1 |
| 29 May 2019, YouGov and Sample size: 1,763 29 May 2019 YouGov 1,763 | 19 | 19 | 24 | 22 | 8 | No data available- | 1 | No data available- | 1 |
| 22 May 2019, Survation and Sample size: 2,029 22 May 2019 Survation 2,029 | 28 | 33 | 13 | 12 | 3 | 3 | 3 | 0 | 2 |
| 21 May 2019, Panelbase and Sample size: 2,033 21 May 2019 Panelbase 2,033 | 21 | 31 | 13 | 19 | 5 | 4 | 3 | No data available- | 4 |
| 20 May 2019, Opinium and Sample size: 2,005 20 May 2019 Opinium 2,005 | 22 | 26 | 12 | 25 | 4 | 4 | 2 | 1 | 2 |
| 17 May 2019, Survation and Sample size: 1,000 17 May 2019 Survation 1,000 | 27 | 32 | 13 | 13 | 3 | 5 | 2 | 0 | 2 |
| 17 May 2019, YouGov and Sample size: 9,260 17 May 2019 YouGov 9,260 | 24 | 24 | 18 | 18 | 6 | No data available- | 2 | No data available- | 2 |
| 16 May 2019, Opinium and Sample size: 2,009 16 May 2019 Opinium 2,009 | 22 | 29 | 11 | 24 | 3 | 4 | 2 | 0 | 3 |
| 14 May 2019, YouGov and Sample size: 1,655 14 May 2019 YouGov 1,655 | 25 | 25 | 16 | 18 | 7 | No data available- | 2 | No data available- | 2 |
| 14 May 2019, Ipsos Mori and Sample size: 1,072 14 May 2019 Ipsos Mori 1,072 | 25 | 27 | 15 | 16 | 7 | 4 | 3 | 1 | 2 |
| 13 May 2019, Hanbury and Sample size: 2,000 13 May 2019 Hanbury 2,000 | 21 | 30 | 13 | 19 | 5 | 4 | 2 | No data available- | 6 |
| 13 May 2019, Kantar and Sample size: 1,152 13 May 2019 Kantar 1,152 | 25 | 34 | 15 | 10 | 3 | 5 | 4 | 2 | 1 |
| 12 May 2019, ComRes and Sample size: 2,028 12 May 2019 ComRes 2,028 | 20 | 27 | 13 | 20 | 4 | 3 | 4 | No data available- | 6 |
| 10 May 2019, Opinium and Sample size: 2,004 10 May 2019 Opinium 2,004 | 22 | 28 | 11 | 21 | 6 | 4 | 4 | No data available- | 4 |
| 10 May 2019, BMG and Sample size: 1,541 10 May 2019 BMG 1,541 | 27 | 30 | 18 | 10 | 6 | 2 | 3 | 0 | 3 |
| 9 May 2019, ComRes and Sample size: 2,034 9 May 2019 ComRes 2,034 | 19 | 27 | 14 | 20 | 5 | 3 | 3 | 1 | 7 |
| 9 May 2019, YouGov and Sample size: 2,212 9 May 2019 YouGov 2,212 | 24 | 24 | 16 | 18 | 7 | No data available- | 2 | No data available- | 2 |
| 7 May 2019, Opinium and Sample size: 2,000 7 May 2019 Opinium 2,000 | 25 | 30 | 11 | 17 | 5 | 3 | 4 | 1 | 2 |
| 30 April 2019, YouGov and Sample size: 1,630 30 Apr 2019 YouGov 1,630 | 29 | 29 | 13 | 15 | 5 | No data available- | 2 | No data available- | 3 |
| 24 April 2019, YouGov and Sample size: 1,787 24 Apr 2019 YouGov 1,787 | 27 | 30 | 11 | 14 | 5 | No data available- | 4 | No data available- | 3 |
| 24 April 2019, Panelbase and Sample size: 2,030 24 Apr 2019 Panelbase 2,030 | 27 | 36 | 8 | 13 | 3 | 4 | 5 | No data available- | 4 |
| 23 April 2019, Opinium and Sample size: 2,004 23 Apr 2019 Opinium 2,004 | 26 | 33 | 6 | 17 | 4 | 5 | 4 | 1 | 4 |
| 17 April 2019, ORB and Sample size: 1,546 17 Apr 2019 ORB 1,546 | 26 | 29 | 8 | 14 | 4 | 4 | 5 | 1 | 5 |
| 17 April 2019, YouGov and Sample size: 1,755 17 Apr 2019 YouGov 1,755 | 29 | 30 | 10 | 12 | 5 | No data available- | 4 | No data available- | 3 |
| 16 April 2019, ComRes and Sample size: 1,061 16 Apr 2019 ComRes 1,061 | 23 | 33 | 7 | 14 | 3 | 3 | 5 | 1 | 9 |
| 12 April 2019, Opinium and Sample size: 2,007 12 Apr 2019 Opinium 2,007 | 29 | 36 | 8 | No data available- | 4 | 5 | 11 | 1 | No data available- |
| 11 April 2019, YouGov and Sample size: 1,843 11 Apr 2019 YouGov 1,843 | 28 | 32 | 11 | 8 | 5 | No data available- | 6 | No data available- | 3 |
| 8 April 2019, Hanbury and Sample size: 2,000 8 Apr 2019 Hanbury 2,000 | 31 | 40 | 8 | No data available- | 5 | 4 | 8 | 1 | No data available- |
| 8 April 2019, Kantar and Sample size: 1,172 8 Apr 2019 Kantar 1,172 | 32 | 35 | 11 | No data available- | 4 | 5 | 7 | 1 | No data available- |
| 7 April 2019, ComRes and Sample size: 2,018 7 Apr 2019 ComRes 2,018 | 32 | 32 | 7 | No data available- | 3 | 3 | 9 | 0 | 9 |
| 5 April 2019, BMG and Sample size: 1,500 5 Apr 2019 BMG 1,500 | 35 | 34 | 11 | No data available- | 5 | 4 | 6 | 1 | No data available- |
| 3 April 2019, YouGov and Sample size: 1,771 3 Apr 2019 YouGov 1,771 | 32 | 31 | 12 | 5 | 4 | No data available- | 7 | No data available- | No data available- |
| 29 March 2019, Opinium and Sample size: 2,008 29 Mar 2019 Opinium 2,008 | 35 | 35 | 9 | No data available- | 5 | 4 | 9 | 0 | No data available- |
| 25 March 2019, YouGov and Sample size: 2,110 25 Mar 2019 YouGov 2,110 | 36 | 33 | 11 | 5 | 4 | No data available- | 4 | No data available- | No data available- |
| 24 March 2019, ComRes and Sample size: 2,030 24 Mar 2019 ComRes 2,030 | 33 | 33 | 8 | No data available- | 3 | 3 | 7 | 1 | 9 |
| 22 March 2019, Opinium and Sample size: 2,002 22 Mar 2019 Opinium 2,002 | 36 | 35 | 7 | No data available- | 4 | 5 | 9 | 1 | No data available- |
| 21 March 2019, ComRes and Sample size: 2,063 21 Mar 2019 ComRes 2,063 | 34 | 35 | 8 | No data available- | 4 | 3 | 7 | 1 | 6 |
| 19 March 2019, Ipsos Mori and Sample size: 1,050 19 Mar 2019 Ipsos Mori 1,050 | 38 | 34 | 8 | 1 | 4 | 5 | 7 | 1 | 2 |
| 17 March 2019, ComRes and Sample size: 2,033 17 Mar 2019 ComRes 2,033 | 34 | 35 | 8 | No data available- | 3 | 3 | 6 | 1 | 7 |
| 15 March 2019, Survation and Sample size: 1,007 15 Mar 2019 Survation 1,007 | 35 | 39 | 10 | No data available- | No data available- | 3 | 5 | 0 | No data available- |
| 15 March 2019, YouGov and Sample size: 1,756 15 Mar 2019 YouGov 1,756 | 35 | 31 | 12 | 4 | 4 | No data available- | 6 | No data available- | No data available- |
| 15 March 2019, Opinium and Sample size: 2,008 15 Mar 2019 Opinium 2,008 | 38 | 34 | 8 | No data available- | 3 | 5 | 8 | 1 | No data available- |
| 11 March 2019, Kantar and Sample size: 1,152 11 Mar 2019 Kantar 1,152 | 41 | 31 | 8 | No data available- | 6 | 5 | 6 | 0 | No data available- |
| 8 March 2019, BMG and Sample size: 1,510 8 Mar 2019 BMG 1,510 | 39 | 34 | 12 | No data available- | 4 | 3 | 5 | 1 | No data available- |
| 5 March 2019, ComRes and Sample size: 2,042 5 Mar 2019 ComRes 2,042 | 36 | 34 | 8 | No data available- | 3 | 3 | 6 | 0 | 8 |
| 4 March 2019, YouGov and Sample size: 2,172 4 Mar 2019 YouGov 2,172 | 40 | 31 | 11 | 3 | 4 | No data available- | 3 | No data available- | No data available- |
| 1 March 2019, Opinium and Sample size: 2,003 1 Mar 2019 Opinium 2,003 | 40 | 34 | 9 | No data available- | 3 | 4 | 7 | 1 | No data available- |
| 23 February 2019, YouGov and Sample size: 1,672 23 Feb 2019 YouGov 1,672 | 41 | 30 | 10 | 2 | 4 | No data available- | 5 | No data available- | No data available- |
| 22 February 2019, Opinium and Sample size: 2,008 22 Feb 2019 Opinium 2,008 | 40 | 32 | 5 | No data available- | 4 | 4 | 7 | 1 | 6 |
| 19 February 2019, Sky and Sample size: 1,034 19 Feb 2019 Sky 1,034 | 32 | 26 | 8 | No data available- | 4 | 4 | 8 | 1 | 10 |
| 19 February 2019, YouGov and Sample size: 1,861 19 Feb 2019 YouGov 1,861 | 41 | 33 | 10 | No data available- | 4 | No data available- | 4 | No data available- | No data available- |
| 18 February 2019, Survation and Sample size: 1,023 18 Feb 2019 Survation 1,023 | 40 | 36 | 10 | No data available- | 2 | 3 | 5 | No data available- | No data available- |
| 15 February 2019, Opinium and Sample size: 2,005 15 Feb 2019 Opinium 2,005 | 37 | 37 | 8 | No data available- | 4 | 4 | 7 | 0 | No data available- |
| 11 February 2019, Kantar and Sample size: 1,145 11 Feb 2019 Kantar 1,145 | 40 | 35 | 10 | No data available- | 4 | 4 | 3 | 1 | No data available- |
| 8 February 2019, BMG and Sample size: 1,503 8 Feb 2019 BMG 1,503 | 38 | 35 | 13 | No data available- | 5 | 3 | 5 | 1 | No data available- |
| 5 February 2019, Ipsos Mori and Sample size: 1,005 5 Feb 2019 Ipsos Mori 1,005 | 38 | 38 | 10 | No data available- | 3 | 4 | 4 | 1 | No data available- |
| 4 February 2019, YouGov and Sample size: 1,851 4 Feb 2019 YouGov 1,851 | 41 | 34 | 10 | No data available- | 4 | No data available- | 4 | No data available- | No data available- |
| 1 February 2019, Opinium and Sample size: 2,008 1 Feb 2019 Opinium 2,008 | 41 | 34 | 8 | No data available- | 4 | 4 | 7 | 1 | No data available- |
| 30 January 2019, Survation and Sample size: 1,029 30 Jan 2019 Survation 1,029 | 38 | 39 | 9 | No data available- | 2 | 3 | 4 | No data available- | No data available- |
| 18 January 2019, ICM and Sample size: 2,046 18 Jan 2019 ICM 2,046 | 39 | 40 | 9 | No data available- | 3 | 3 | 5 | 0 | No data available- |
| 18 January 2019, Opinium and Sample size: 2,006 18 Jan 2019 Opinium 2,006 | 37 | 40 | 7 | No data available- | 4 | 5 | 7 | 1 | No data available- |
| 17 January 2019, ComRes and Sample size: 2,031 17 Jan 2019 ComRes 2,031 | 38 | 37 | 10 | No data available- | 3 | 3 | 6 | 1 | No data available- |
| 15 January 2019, ComRes and Sample size: 2,010 15 Jan 2019 ComRes 2,010 | 37 | 39 | 8 | No data available- | 3 | 3 | 7 | 0 | No data available- |
| 14 January 2019, YouGov and Sample size: 1,701 14 Jan 2019 YouGov 1,701 | 39 | 34 | 11 | No data available- | 4 | No data available- | 6 | No data available- | No data available- |
| 14 January 2019, Kantar and Sample size: 1,106 14 Jan 2019 Kantar 1,106 | 35 | 38 | 9 | No data available- | 4 | 4 | 6 | 1 | No data available- |
| 11 January 2019, Survation and Sample size: 1,013 11 Jan 2019 Survation 1,013 | 38 | 41 | 10 | No data available- | 2 | 3 | 4 | No data available- | No data available- |
| 11 January 2019, BMG and Sample size: 1,514 11 Jan 2019 BMG 1,514 | 36 | 36 | 12 | No data available- | 5 | 3 | 6 | 1 | No data available- |
| 7 January 2019, YouGov and Sample size: 1,656 7 Jan 2019 YouGov 1,656 | 41 | 35 | 11 | No data available- | 3 | No data available- | 4 | No data available- | No data available- |
| 4 January 2019, YouGov and Sample size: 25,537 4 Jan 2019 YouGov 25,537 | 40 | 34 | 10 | No data available- | 4 | No data available- | 4 | No data available- | No data available- |
Methodology: How was the poll tracker chart put together?
Which polls do we use?
We use polls conducted by members of the British Polling Council.
As of September 2019, that's BMG, ComRes, Deltapoll, Hanbury, ICM, Ipsos Mori, Kantar, Opinium, ORB, Panelbase, Sky Data, Survation and YouGov.
Most of the polls included cover Great Britain, although some do poll the whole of the UK, but as a result we do not have separate data for parties that only stand in Northern Ireland.
What is the margin of error?
The margin of error is plus or minus four percentage points.
This means that there's a 90% chance that an election held tomorrow would give national vote shares within four points of our estimates for each of the parties.
And there's a 10% chance that it would be outside that range. We base these figures on a British Polling Council analysis of the results of the final set of polls before each of the elections from 2001 to 2017.
What about parties that only campaign in Scotland or Wales?
The approach mentioned above doesn't quite work for parties that only run in Scotland or Wales. The electorate they are appealing to is smaller and this makes their possible vote smaller when it is projected across Great Britain or the whole of the UK.
This also means that their margin of error is smaller than that of those parties that stand across Britain and is likely to be less than + / - 1%.
We have more coverage of politics in Scotland and Wales on their national politics pages.
How do we average the polls?
Our estimate of a party's support is a rolling average of polls to date. Bigger and more recent polls have more influence on our figures.
We also limit the influence of any one poll or of those polling firms who poll very frequently to prevent our results being too dependent on one source.
In a little more detail: the average is weighted by sample size. The more people polled in a particular survey, the more weight we will give it, up to a threshold of 2,000 people.
On the other hand, the older a poll is the less influence it has on the average figure we calculate. We also give less value to any polling firm that has data for more than 5,000 people in a fortnight. A typical poll may cover about 1,000 people.
Why is there a margin of error?
Because a party isn't guaranteed to get the same vote share in an election as it did in a poll the previous day.
Polling a sample of the population has often been likened to tasting soup. If the soup has been well stirred then you need to have only one spoonful to get a sense of what the whole bowl is like.
In the same way, a well-conducted poll of 1,000 people can, most of the time, give us an idea of what the country as a whole is thinking.
But it's not 100% precise, so, the margin of error gives a sense of how the results might change with a different sample of 1,000 people.
This margin of error only applies to national vote share: converting that into seats in Parliament is much harder and less precise.
Why do polling companies give such different answers?
There are also systematic differences between polling companies who approach people in different ways, who ask different questions and who analyse the results differently.
We list the main polling firms and the questions they ask below. Polling companies also analyse their data differently. They make choices about how to weight each respondent.
For example, if a poll of 1,000 people is made up of 550 men and 450 women, it is unrepresentative because it does not reflect the profile of the UK population (51% female).
So the answers of female respondents should be given slightly more weight than male respondents in the analysis so that the final results are 51% based on female answers rather than 45%.
That's not controversial, but adjusting for past vote or likelihood to vote is harder. Some pollsters ask respondents who they voted for last time and weight the sample to try and ensure it matches the political make-up of the general population.
One problem with doing this is that a certain number of people will incorrectly recall who they voted for last time - and a few will even lie about it. So polling companies often use a variety of further methods to improve the accuracy of their weighting.
That variety of methods leads to a variety of answers. Most companies then weight or filter by likelihood to vote so that the answers of people who are most likely to vote are given the most prominence in the results.
Finally, several pollsters reallocate a percentage of "don't knows" to the party they voted for last time. This is to get around the problem that emerged following the 1979 election with the phenomenon of "shy Tories" or the "spiral of silence" - people who do not want to discuss their voting preference but who will still vote.
Questions asked by each pollster:
BMG
If a general election were held today, which of the following parties would you vote for?
Conservative, Labour, Liberal Democrat, SNP (if living in Scotland), Plaid Cymru (if living in Wales), Green Party, Brexit Party, another party
Prior to August 2019, Green Party and Brexit Party were only prompted for if the respondent answered "another party". Following a randomised controlled trial, BMG decided to move those two parties into the main prompt list. The Independent Group for Change and UKIP remain in the secondary prompt list.
ComRes
If there were a (UK) general election tomorrow to elect MPs to Westminster, would you vote Conservative, Labour, Liberal Democrat, Brexit Party, SNP, Plaid Cymru, or for another party?
Deltapoll
If there were a general election held tomorrow, which party would you vote for? SELECT ONE: Conservative, Labour, Liberal Democrat, UK Independence Party (UKIP), Scottish National Party (SNP), Plaid Cymru (PC), Brexit Party, Green, Some other party
Hanbury Strategy
If a general election is held in October before the Brexit deadline of 31 October, which party would you vote for?
ICM
If there were a general election tomorrow, which party would you vote for?
Ipsos Mori
How would you vote if there were a general election tomorrow?
Kantar Public
Voting intention for next general election - online pre-coded list: Conservative, Labour, Liberal Democrats, UKIP, Green, SNP, Plaid Cymru
- Note: Brexit Party and The Independent Group for Change were not included in the pre-coded list but respondents had opportunity to select subsequently
Opinium
If there were a general election tomorrow, for which party would you vote?
ORB
If there were an election tomorrow, which party would you vote for?
Labour Party, Conservative Party, Brexit Party, Liberal Democrat, The Independent Group, UKIP, Green Party, SNP, DUP, Plaid Cymru, Sinn Fein, Ulster Unionist Party, Women's Equality Party.
Panelbase
Who would you vote for if a UK Parliamentary election took place tomorrow?
Conservative, Labour, Liberal Democrat, The Brexit Party, SNP, Green, Change UK (The Independent Group), UKIP, Other.
Sky Data
If there was a general election tomorrow and candidates for all parties were standing in your constituency, including the new "Independent Group" of former Labour MPs who have split from the Labour Party, how would you vote? Conservatives, Labour, Independent Group, Liberal Democrats, Other, UKIP, Green Party, SNP, Plaid Cymru
Survation
Respondents were asked who they would be most likely to vote for if that election were tomorrow, with the responses "Labour", "Conservative", "Liberal Democrat" prompted in a randomising order, and other parties displayed if respondents selected "Another Party".
YouGov
If there were a general election held tomorrow, which party would you vote for?
Conservative, Labour, Liberal Democrat, Scottish National Party (SNP), Plaid Cymru, Brexit Party, Green, Some other party (if this answer selected then respondents are prompted the following: UK Independence Party (UKIP), Women's Equality Party, Independent Group for Change).