The following commentary does not necessarily reflect the views of AgWeb or Farm Journal Media. The opinions expressed below are the author's own.
The Ted Spread
RSS
By: Ted Seifried, AgWeb
Ted is the Chief Market Strategist and Vice President in charge of the Zaner Ag Hedge Group and specializes in agricultural hedging employing various strategies using futures, futures spreads, outright options and option combinations. He believes it is paramount to be able to use different strategies to adapt to market conditions. Ted works with large to mid size grain and livestock producers and end users in North, Central and South America.
What does Planted Acreage mean for Soybeans?
Jun 27, 2019
TRADING COMMODITY FUTURES AND OPTIONS INVOLVES SUBSTANTIAL RISK OF LOSS AND MAY NOT BE SUITABLE FOR ALL INVESTORS. YOU SHOULD CAREFULLY CONSIDER WHETHER TRADING IS SUITABLE FOR YOU IN LIGHT OF YOUR CIRCUMSTANCES, KNOWLEDGE AND FINANCIAL RESOURCES.
The USDA will release the Planted Acreage report on Friday, a report that typically sets the acreage until final revision are made next January. This year may be a little less cleat cut, especially for soybeans. How much stocks should we put into this report?
In a normal year planting is wrapping up at the beginning of June. This year the weather has given farmers a very hard time getting crops in. The reality is that this has been one of the slowest, wettest, coolest planting seasons on record. As of June 3rd, we still had roughly 30 million acres of corn and a little over 50 million acres of soybeans to plant.
This is significant because this Planted Acreage report is based off a USDA survey of farmers done from May 30th to June 10th. With that many acres still yet to plant how could the USDA get a clear picture of what final acreage will be? Basically, this report has become a Planting Intentions 2.0 report.
Sign up for our Morning Ag Hedge newsletter! Sign up here: http://www.zaner.com/landing/ag_hedge_newsletter.asp
For soybeans in particular, it may be an inaccurate read of what the reality is. This is because when farmers are struggling at the beginning of June to get the corn crop in they may be planning to switch corn acres to soybeans or Prevent Plant or they may have held out hope to plant corn for a few more days. Then there is weather which has not allowed easy planting progress since then. Really this survey was about what farmers were still intending to plant, but the reality could be far different.
The reality is that much of what was intended to still be planted at the beginning of June may have not gotten planted. And, the later corn or soybeans are planted the bigger the risk that they will not make it before a frost. This means the much of the planted acreage might not make it to harvest anyway.
One way the USDA could handle it is by keeping the higher planted acreage number but lowering the yield to effectively lower production to more realistic levels. The problem here however is that we will not see a yield revision on this report, we will have to wait until the July 11th WASDE report for that.
If the Planted Acres are bigger than what the trade is expecting it will be interesting to see how the trade reacts. Most people that are paying attention should realize that this survey probably came too early this year to provide an accurate representation of reality. Hopefully, the market will understand the dynamics and take it with a grain of salt. That is unless, the USDA goes against their typical method and does a whole lot of analysis and adjusting of the numbers, but that might be a surprise.
We have complimentary 2019 commodity reference calendars available. They are a little bigger than pocket sized and very useful if you follow markets. You can sign up for yours here - http://www.zaner.com/offers/calendar.asp (Shipping to the US only)
Give us a call if you would like more info on the strategies we are using or if you would like to set up an account to put a plan in action. Ted Seifried - (312) 277-0113. Also, feel free to give me a call or shoot me an email if you would like to talk about your marketing plan, the markets, weather, or just to visit. Find me on twitter - @thetedspread
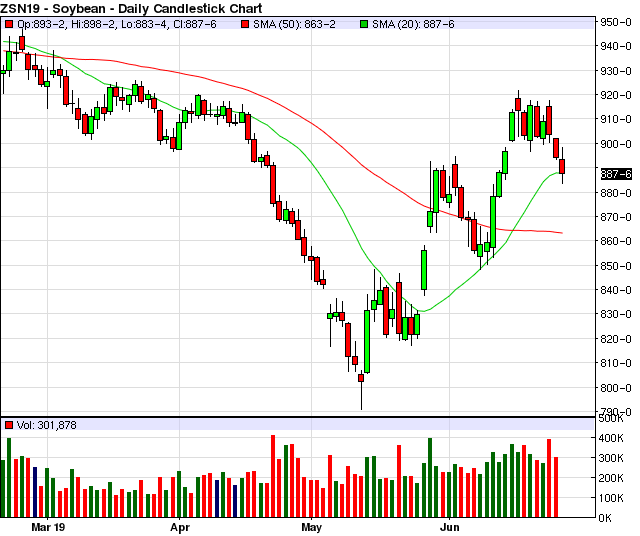
July Soybean Daily Chart:
Producers looking to hedge all or a portion of their production may be rather interested in some of the options / options-futures strategies that I am currently using.
In my mind there has to be a balance. Neither technical nor fundamental analysis alone is enough to be consistent. Please give me a call for a trade recommendation, and we can put together a trade strategy tailored to your needs. Be safe!
Ted Seifried (312) 277-0113 or tseifried@zaner.com
Additional charts, studies, and more of my commentary can be found at: http://markethead.com/2.0/free_trial.asp?ap=tseifrie
FOR CUSTOMERS TRADING OPTIONS, THESE FUTURES CHARTS ARE PRESENTED FOR INFORMATIONAL PURPOSES ONLY. THEY ARE INTENDED TO SHOW HOW INVESTING IN OPTIONS CAN DEPEND ON THE UNDERLYING FUTURES PRICES; SPECIFICALLY, WHETHER OR NOT AN OPTION PURCHASER IS BUYING AN IN-THE-MONEY, AT-THE-MONEY, OR OUT-OF-THE-MONEY OPTION. FURTHERMORE, THE PURCHASER WILL BE ABLE TO DETERMINE WHETHER OR NOT TO EXERCISE HIS RIGHT ON AN OPTION DEPENDING ON HOW THE OPTION'S STRIKE PRICE COMPARES TO THE UNDERLYING FUTURE'S PRICE. THE FUTURES CHARTS ARE NOT INTENDED TO IMPLY THAT OPTION PRICES MOVE IN TANDEM WITH FUTURES PRICES. IN FACT, OPTION PRICES MAY ONLY MOVE A FRACTION OF THE PRICE MOVE IN THE UNDERLYING FUTURES. IN SOME CASES, THE OPTION MAY NOT MOVE AT ALL OR EVEN MOVE IN THE OPPOSITE DIRECTION.
Comments
Leave a Comment
 Loading News