
 GET APP


(Image: AFP)
Loading...
The visitors outplayed the home-team in both batting and bowling and were the deserving winners of the bilateral series.
Dhoni’s remarkable comeback to form, Chahal’s match-winning performance in the final, Bhuvneshwar’s consistency with the ball, the resurgence of India’s middle-order and the domination of India’s top 3 – there were a lot of positives for India from the series.
We analyze some numbers which defined the series.
46.81: India’s batting average in the series. It was 14.23 runs per dismissal more than Australia’s batting average (32.58).
43.66: The batting average of India’s top 3. The corresponding average for Australia was 20.77. This was a major difference between the two sides. The Indian top-order also scored at 86.37 per hundred balls. The strike rate for Australia’s top-order was 67.26.
73: The combined aggregate of the Australian openers – Finch and Carey – in the series. Dhawan and Rohit aggregated 240 in the series. The left-hander contributed just 55.
10: The number of consecutive series/tournaments in which Rohit has registered at least one hundred (starting with the Champions Trophy in England in June, 2017)
9: The number of innings Dhawan has batted without registering a 40
8.66: Aaron Finch’s batting average in the series. He scored 26 runs in 3 innings at a strike rate of 48.14.
7: Number of consecutive series/tournaments that Australia have ended up on the losing side/not won.
224: Highest aggregate in the series – Shaun Marsh
193: Dhoni’s aggregate in the series and also his batting average (two not-outs) – he was the highest run-getter for India in the series and the second-highest overall.
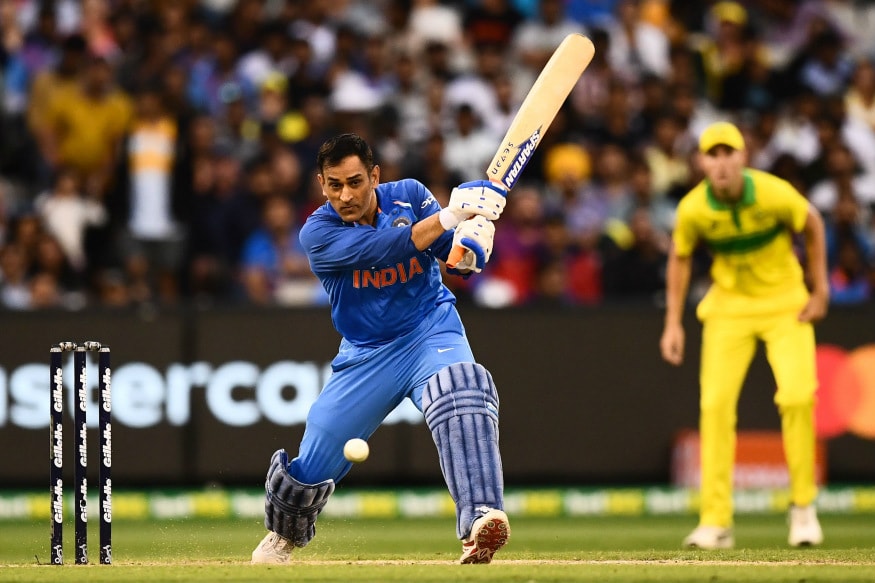
3: The number of fifties Dhoni registered in as many matches in the series
323: The number of runs scored by the Indian middle-order (4-7) in the series. They averaged 64.60 per dismissal – a good result for India given their recent middle-order woes.
8: The highest number of wickets in the series – Bhuvneshwar Kumar
6-42: Yuzvendra Chahal’s best bowling figures in his ODI career. He equaled the record for the best bowling figures in an ODI in Australia (6-42 by Ajit Agarkar against Australia at MCG in 2004)
3.73: The economy rate of Jhye Richardson in the series – the most restrictive bowler in the series
23: The total number of wickets taken by India in the series. Australia took 16.
13.17: The difference in bowling averages between the two teams – India (34.95), Australia (48.12).
38.7: The strike rate of India’s bowlers in the series. In comparison, the Australian bowlers bowled 55.7 balls, on an average, per wicket. This showcased the potency of the Indian attack with the ball whereas highlighted the lack of fire power in Australia’s bowling unit.
2: Number of wickets picked by Siddle in 3 innings. He had the worst bowling average of 81 in the series. He was also very expensive conceding runs at a rate of 6.48 per over.
8: Match-streak of Kuldeep Yadav where he has at least picked one wicket in the match. This was broken when he went wicket-less at the MCG.
First Published: January 18, 2019, 9:11 PM IST
 Batting Becomes Easier With Dhoni: Jadhav
 Dhoni is a Superstar and All-time Great: Langer
 Dhoni Can Control the Game From One End: Tendulkar


 Live TV