
 GET APP


Virat Kohli holds up the Border–Gavaskar Trophy as he celebrate their series win over Australia. (Image: AP)
Loading...
This was the first win Down Under in 31 series by any team from the subcontinent – such was the magnitude of the victory.
Should India have won by an innings in Sydney (which, was on the cards until if rain hadn’t intervened), it would have been only their third innings victory in SENA (South Africa, England, New Zealand, Australia). Sydney was also the first time in 31 years, since 1988, that Australia were asked to follow-on at home – encapsulating India’s dominance in the series.
India won two Tests in this series – only the fourth-instance when they have won at least two Tests in a series in SENA – after 1967-68 in New Zealand, 1977-78 in Australia and 1986 in England – it has been such a challenge for any visiting team from the subcontinent.
India were, by far, the stronger team in all departments – batting, bowling and even fielding and completely outplayed Australia in their own backyard. Let us look closer at the numbers from this dominant Indian performance.
OVERALL
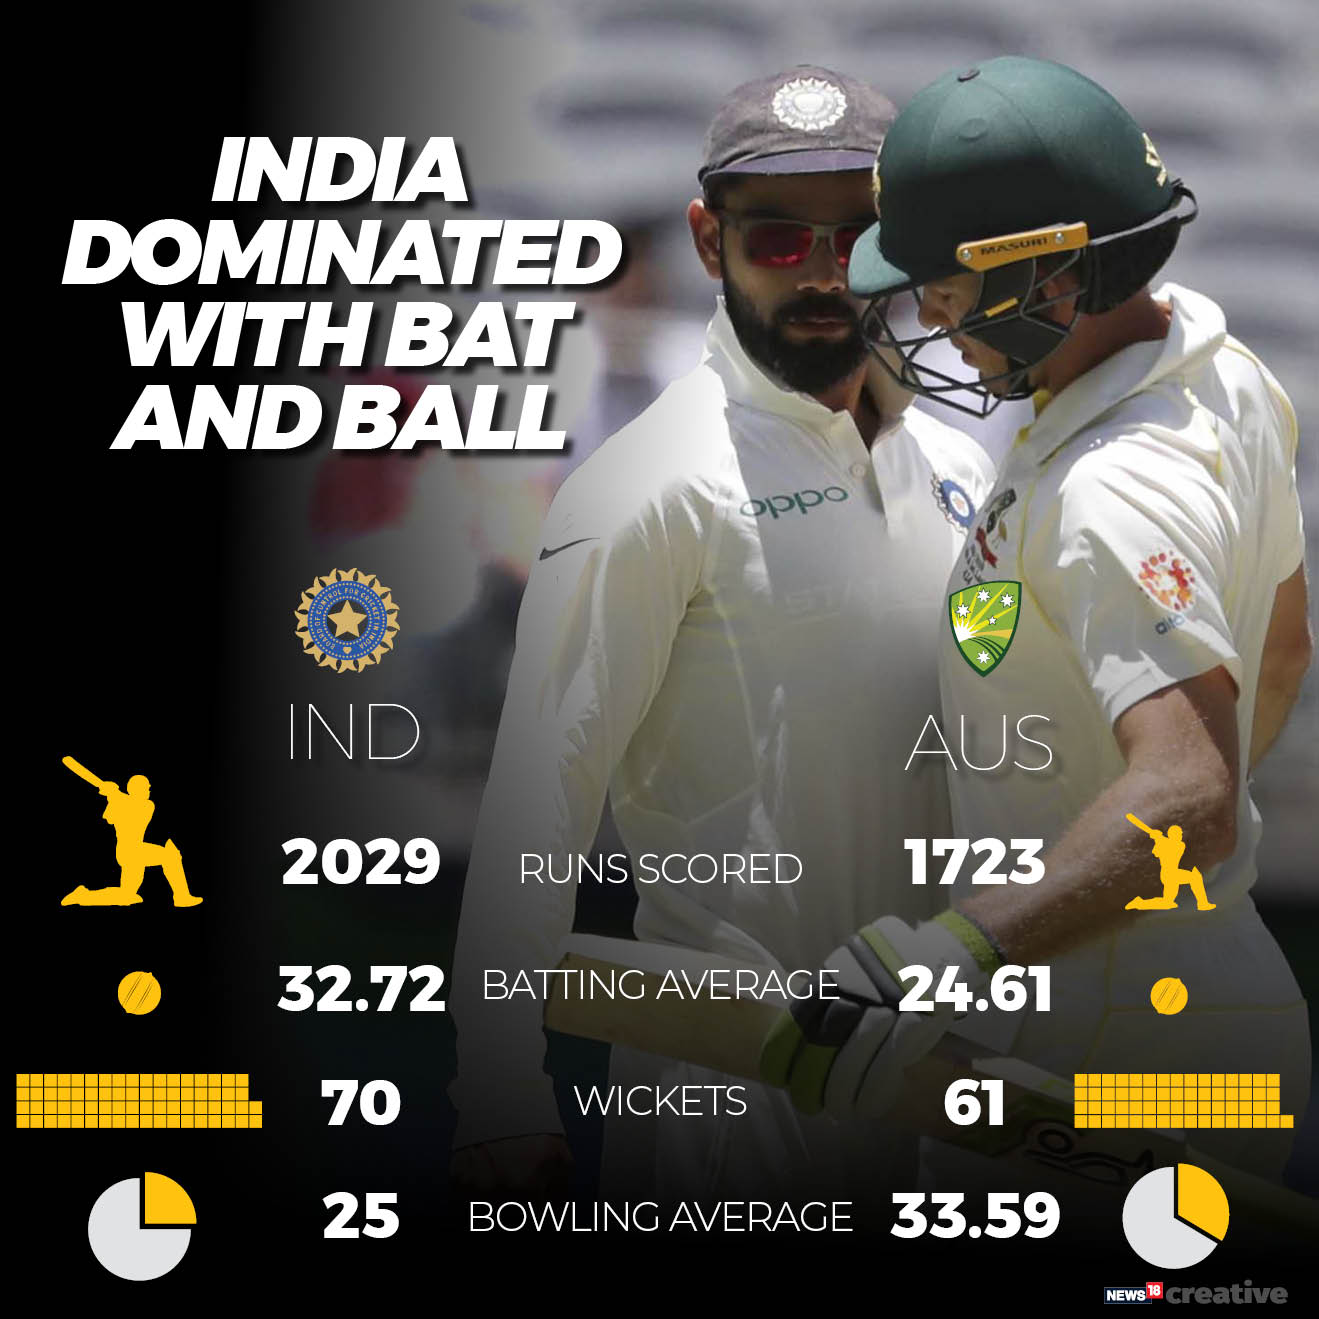
India’s batting average in the series was 32.72 – their fourth-best in Australia in 12 series. But it was their extraordinary bowling that won them the series – their bowling average of 25 was the best ever for an Indian team in Australia.
Australia’s batting average in the series was a dismal 24.61 – not only their worst against India but also their worst against any sub-continent side at home ever (in series with three or more Tests). Overall, this was Australia’s 11th lowest batting average amongst the 93 series they have played at home .Their bowling average in the series was 33.59.
This means that India scored 8.11 runs per dismissal more and conceded 8.59 runs per dismissal less compared to Australia in the series.
The differential between Batting Average and Bowling Average of 7.72 for India in this series was their second-best ever in Australia (after 1985-86) and their third-best in SENA ever (three or more Tests in a series) after Australia (1985-86) and New Zealand (2008-09).
The differential between Batting Average and Bowling Average of -8.97 for Australia is their second-worst against India in a home series (after 1985-86) and their 10th worst overall in 93 home series.
The first innings difference at Sydney and Melbourne between the two sides was 322 and 292 – these are the two highest leads in Australia for India – another indicator of India’s superiority in batting over their opponents in this series.
India had the better of Australia in three out of the four Tests –both batting and bowling.
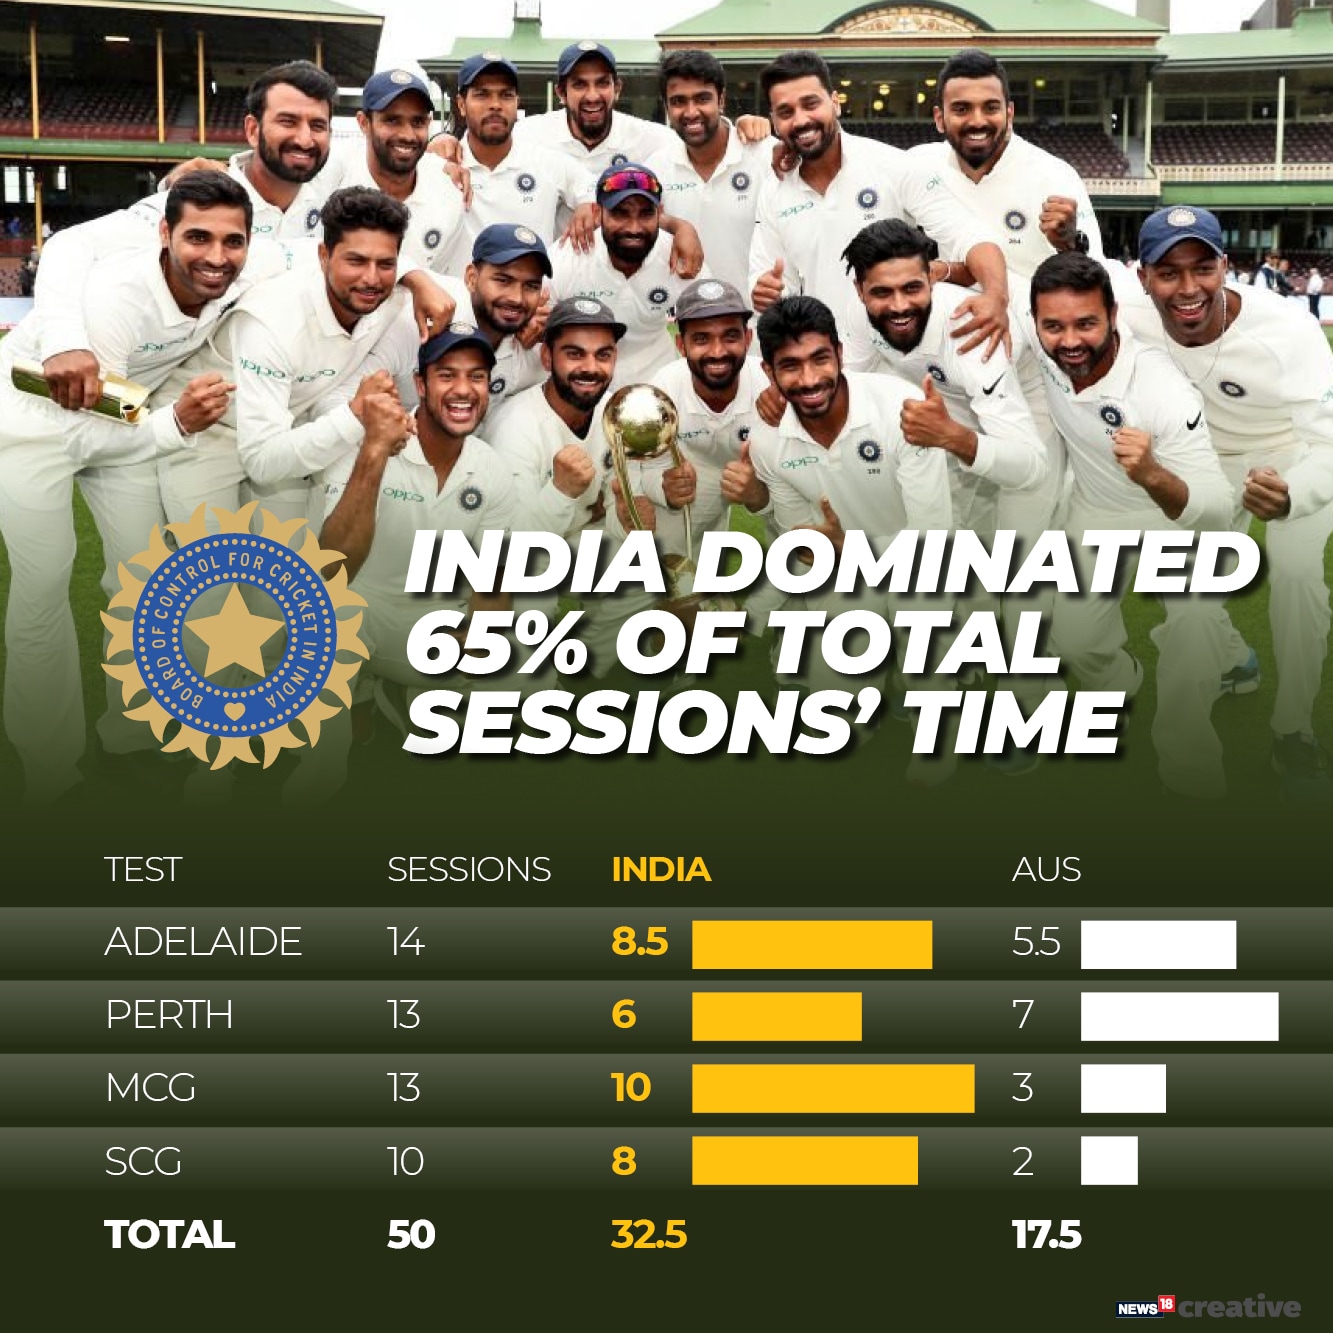
India dominated play for 65% of the total time spent by the teams in the middle. They won 32.5 out of the 50 sessions in the series. Australia won just 17.5.
BATTING
India’s batting line-up (1-7) scored 1888 runs in the series at an average of 40.17.
Australia’s batting line-up (1-7) scored just 1309 at 26.71 apiece.
Overall, the Indian batsmen registered 5 hundreds in the series.
No Australian batsman scored a hundred in the series – only the third-time in 93 home-series (three or more Tests in a series) that no Australian batsman could reach three-figures in any innings.
In fact, Marcus Harris’ 79 in the first innings at Sydney is the lowest-highest individual score by an Australian in any series (two or more Tests) in 129 years!
Cummins and Starc had a higher aggregate and average than Handscomb and Finch in the series.
That is how poor it was for the Aussies. And this sums up the difference in the batting prowess of the two teams.
The weak Australian middle-order was their bane. In fact, their openers did a better job against the new ball in comparison to the Indian openers. This was courtesy the efforts of Marcus Harris, who with 258 runs was Australia’s leading scorer and most accomplished batsman of the series.Aaron Finch had a nightmare of a series scoring just 97 runs in 6 innings at 16.16 apiece.But Rahul and Vijay fared even worse – aggregating just 57 (in 5 innings) and 49 (in 4 innings) at shocking averages of 11.40 and 12.25 respectively.
The Indian openers scored 322 runs at an average of 23 in the series. There were two fifties – both by Mayank Agarwal. The Australian openers fared marginally better scoring 386 runs at an average of 27.57 in the series. They registered three fifties.
However, India’s 3, 4 and 5 completely outbatted their Australian counterparts. They aggregated 1020 runs at an average of 48.57 with 4 hundreds and 4 fifties. Their Australian counterparts could only muster 530 at an appalling average of 25.23 with no hundred and two fifties. This was the difference in the batting between the two teams.

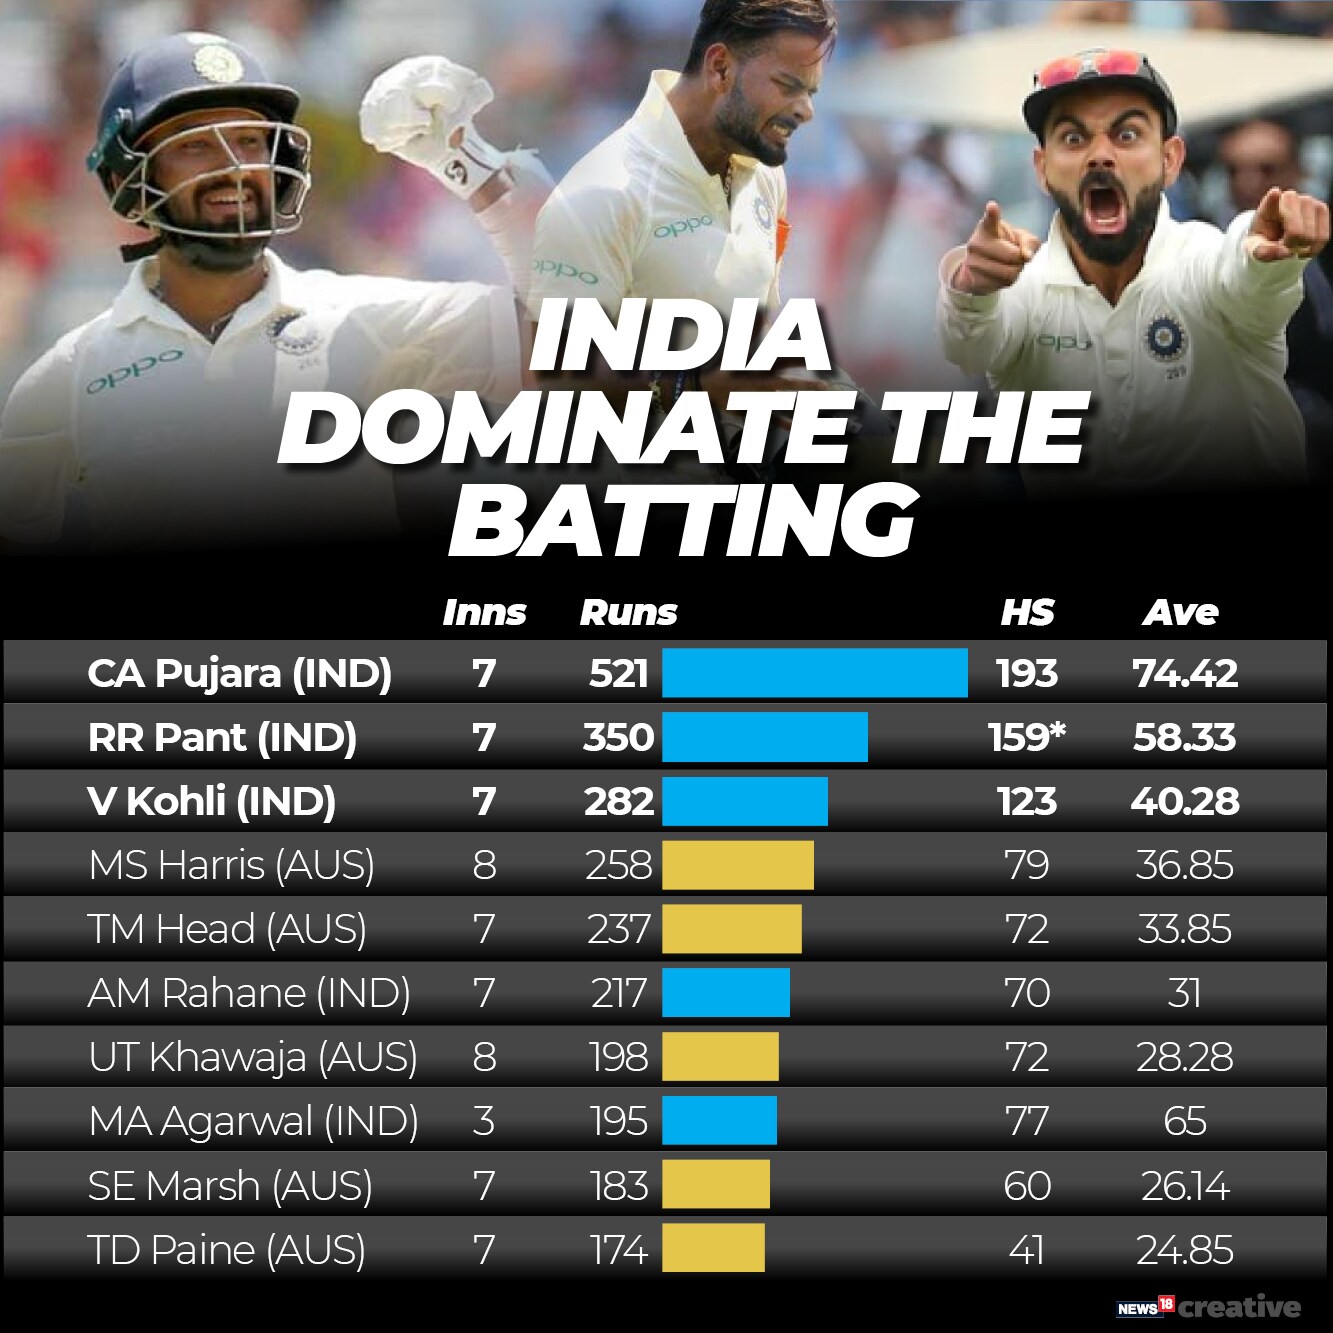
Pujara (521 runs, average of 74.42), Kohli (282, 40.28) and Rahane (217, 31) top the runs and average charts in the top-middle order (only runs scored from positions 3, 4 and 5).
Compare this to the Australians – Shaun Marsh (183, 26.14), Khawaja (167, 27.83) and Head (74, 24.66).
The collective failure of Australia’s 3, 4 and 5 was the main reason for their dismal performance in the series.
Pujara was the batsman of the series. There was a difference of 171 runs between him and the second-highest scorer – Pant (350).
He also broke the record for facing the maximum number of deliveries for a visiting batsman in a series (4 or less Tests) in Australia – he faced 1258 deliveries in 7 innings. Sutcliffe faced 1237 (in 7 innings) in the 1928 Ashes. Dravid had faced 1203 in 2003 while Kohli faced 1093 in 2014 – though both batted in one extra innings.
Only three Australians made it to the top 10 in batting averages in the series. Apart from Harris (36.85) and Head (33.85), no other Australian batsman averaged above 30 in the series (min 2 innings).
Handscomb was dismissed for less than 30 in 3 out of 5 innings in the series, Head (4 out of 7), Khawaja and Harris (6 out of 8), Shaun Marsh (4 out of 7) and Finch (5 out of 6) – that is in 28 of a total of 41 innings the core of the Australian batting line-up scored less than 30.
There were five hundred partnerships in the series – four involved the Indian batsmen. Finch and Harris put on 112 at Perth. Out of the ten 80-plus stands in the series, 8 involved an Indian pair.
BOWLING
The Indian bowling unit outshone the more fancied Australian bowling unit and that was the surprise revelation of the series. Overall, the Indian bowlers bagged 70 wickets at an average of 25 and strike rate of 58.7. The Australians aggregated 61 at an average of 33.59 and strike rate of 71.9.
This means that the Indian bowlers conceded, on an average, 8.59 run per wicket less than their Australian counterparts and also bowled approximately 13 balls less per dismissal – that is a massive difference.
The Indian bowlers were also more restrictive conceding at 2.55 per over compared to Australia’s 2.80 per over.
The Indian trio of Bumrah, Shami and Ishant outshone Cummins, Hazlewood and Starc in the series.
Overall, the Indian pacers (including Umesh Yadav) picked 50 wickets at 23.54 apiece while the Australian pace battery picked 40 at 32.27 apiece. The difference is even more glaring if we compare the strike rates – the Indian fast bowlers picked a wicket every 52 deliveries as compared to the Australians – 69.4 – that is a difference of almost 18 balls (3 overs) per dismissal.

This performance by the Indian pace battery (in terms of average and strike rate) is the best ever for any pace attack to visit Australia from the subcontinent – yes, they were that good!
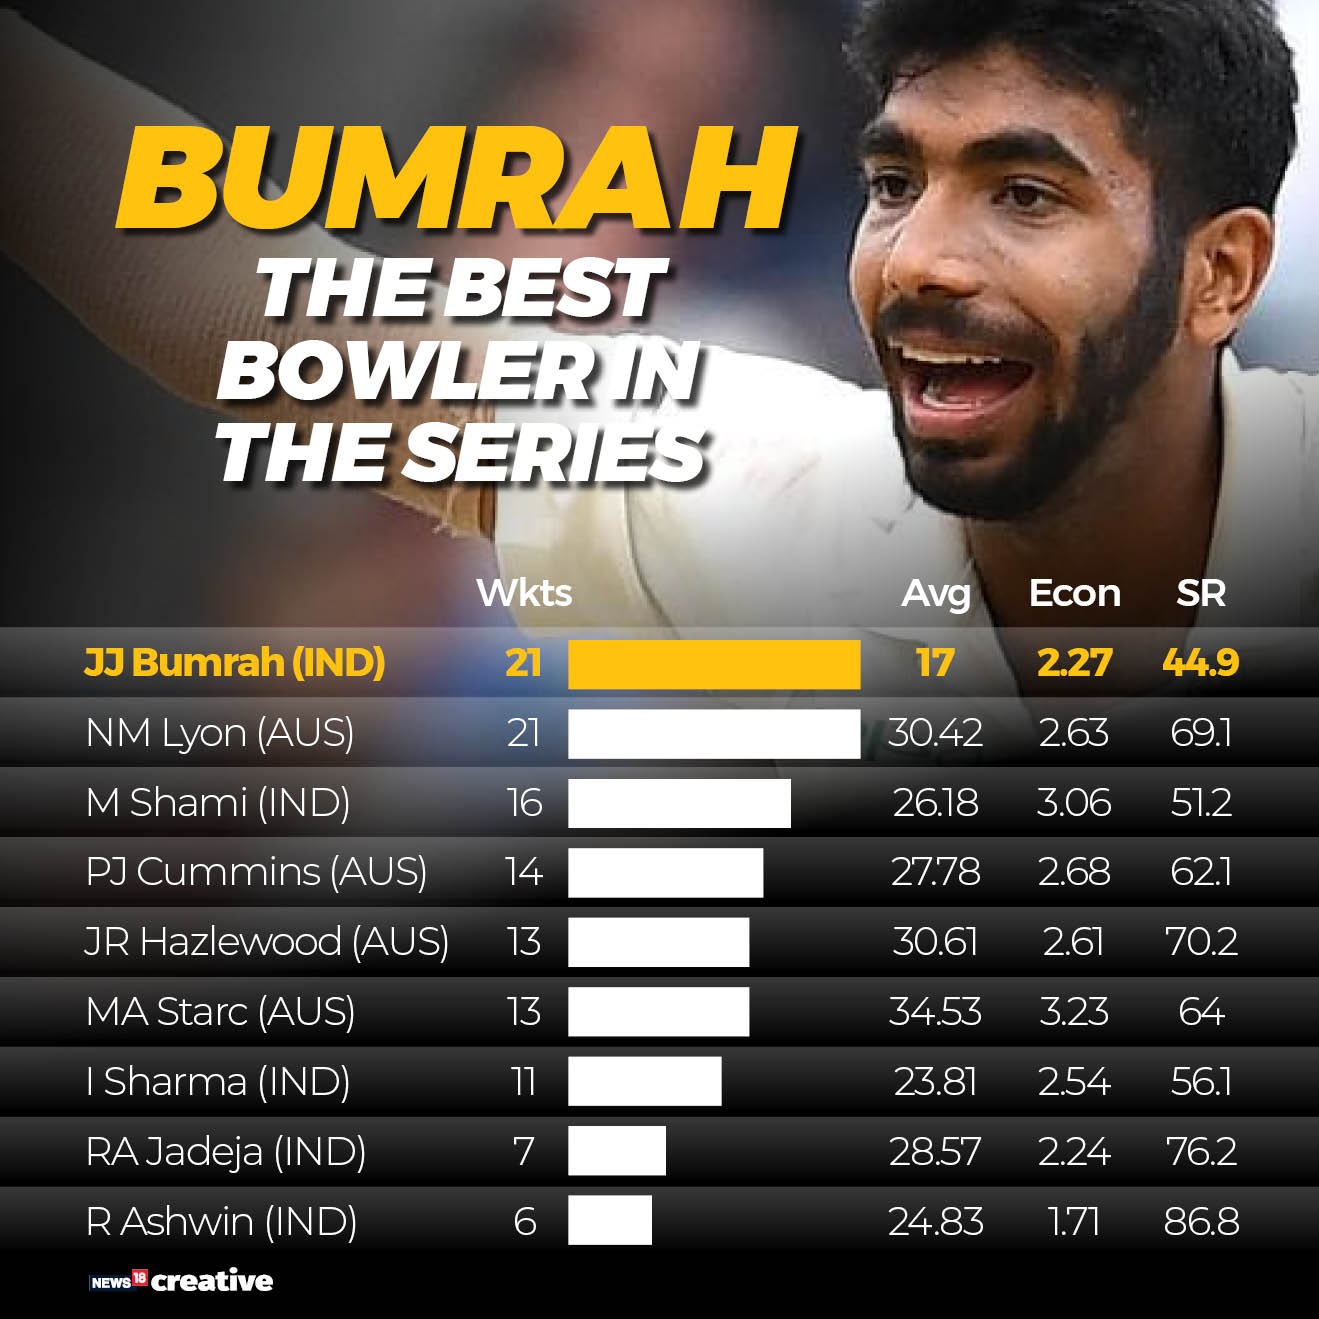
Bumrah was the stand-out bowler in the series. He was the joint-lading wicket taker (with Lyon) with 21 wickets. His average of 17 and strike rate of 44.9 was, by far, the best for any bowler in the series. In fact such was his dominance in the series that the difference between him and the second-best, Ishant (in terms of average) is 6.81 and Shami (in terms of strike rate) is 6.3. Bumrah was also the most restrictive pace bowler conceding just 2.27 runs per over.
Bumrah’s tally of 21 wickets is the second-highest for an Indian pacer in any series in Australia – after Kapil Dev’s 25 in 1991. His average of 17 and strike rate of 44.9 are also the best ever for an Indian pacer in Australia (min. 5 wickets in a series).
In fact, his average is the best ever for any pace bowler from the subcontinent (min. 4 innings and 5 wickets in the series) in any series Down Under, eclipsing Wasim Akram’s 18.70 in 1990.
Shami and Ishant gave excellent support to Bumrah. Shami picked up 16 wickets at 26.18 apiece while Ishant accounted for 11 at 23.81 apiece. Their strike rates (both below 60) were also very impressive.
Cummins was the only Australian pacer who stood out aggregating 14 wickets at 27.78. Hazlewood bowled well in bursts but was inconsistent as his average of above 30 and strike rate of above 70 suggests. Starc looked a bit out of sorts in the series and went for 34.53 apiece for his 13 wickets.
Lyon was the pick of the Australian bowlers bagging 21 wickets at 30.42 apiece with two five-wicket hauls in an innings.
The Indian spinners played an effective supporting role. Jadeja picked up 7 wickets while Ashwin took 6 (in the only Test he played at Adelaide). Both of them were highly restrictive too. Kuldeep picked up a fifer in the only innings he bowled in the series – in Sydney – and did his credentials no harm as a potent strike bowler for India in overseas conditions.
India were also the better fielding unit across the series. Though, they too dropped a few catches, their performance on the field was much better than their adversaries’. Australia’s catching was particularly poor in the series.
To put this victory in perspective - India has won only 22 of the 153 Tests it has played in SENA. This victory Down Under was only their sixth in 46 series in these countries.
The numbers tell the story.
First Published: January 7, 2019, 4:38 PM IST
 Fellow Left-Arm Wrist Spinners Relish Kuldeep’s Sparkle
 Pujara's Incredible Series Numbers Get Even Better
 Pant Becomes First Indian Wicket-keeper to Score Ton in Oz


 Live TV