 GET APP


ICC
Loading...
Any guesses? Not PNG, not Namibia, not Hong Kong, not Nepal.
Well, shockingly, that is the ODI record (from 30th of January, 2017) of current World Cup holders, Australia!
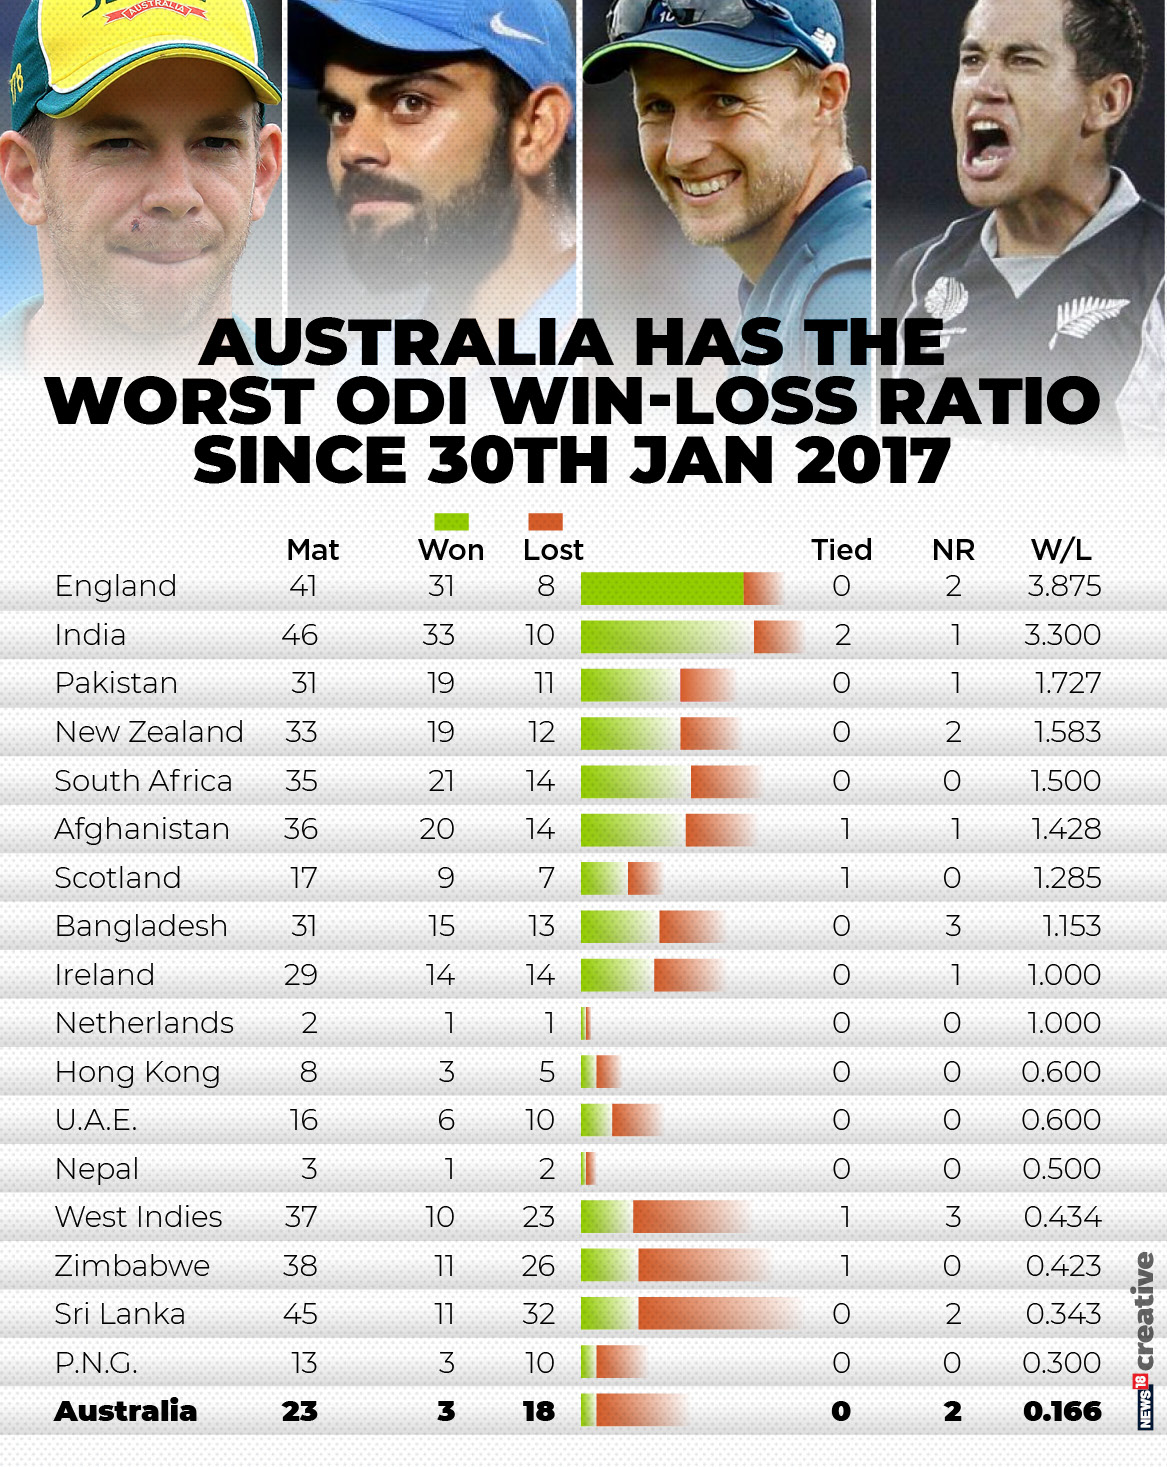
Australia have the worst win-loss ratio in ODI cricket since the Chappell-Hadlee Trophy in New Zealand in January, 2017 (since 30th Jan. 2017 in Auckland). They are at number 18 with a lower win-loss ratio than UAE, Nepal, Hong Kong and even PNG – such has been the hapless state of Australia in ODI cricket.
They have lost 5 bilateral series on the trot in this time period (two home and three away) and also failed to make the semi-finals of the Champions Trophy in England.
Yes, they have had no easy matches and have faced the toughest opponents in ODI cricket – England, India, South Africa and New Zealand – but their performances have been consistently poor.
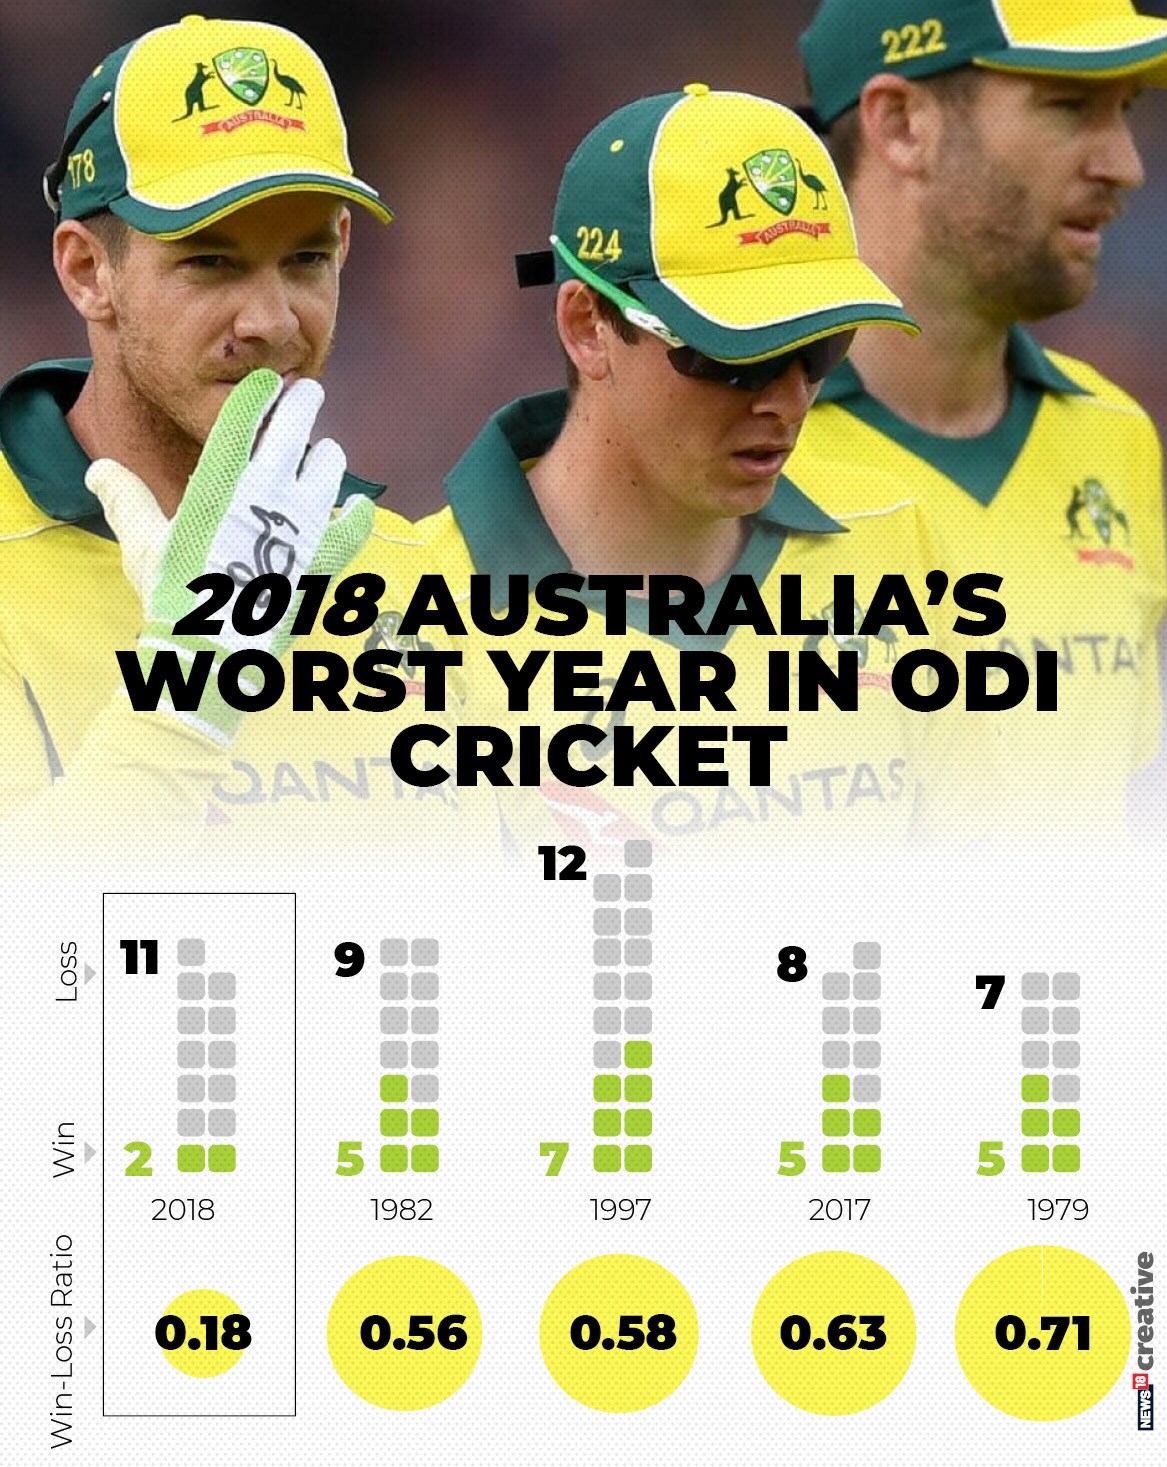
THE WORST YEAR
2018 has been the lowest point in Australia’s ODI cricket history – yes – that is how bad it has been for them this year.
They have lost 11 out of the 13 ODIs they have played this year. They do not play any more ODIs in 2018 which confirms that it would be their worst year – in terms of win-loss ratio.
Australia also succumbed to their worst defeat in ODI history – by 242 runs – against England in Nottingham on the 19th of June, 2018.
They had a poor 2017 too - amongst the four worst years for Australia in terms of win-loss ratio in ODI cricket (min. 5 matches in a year).
The main reason for this slump has been their woeful batting.
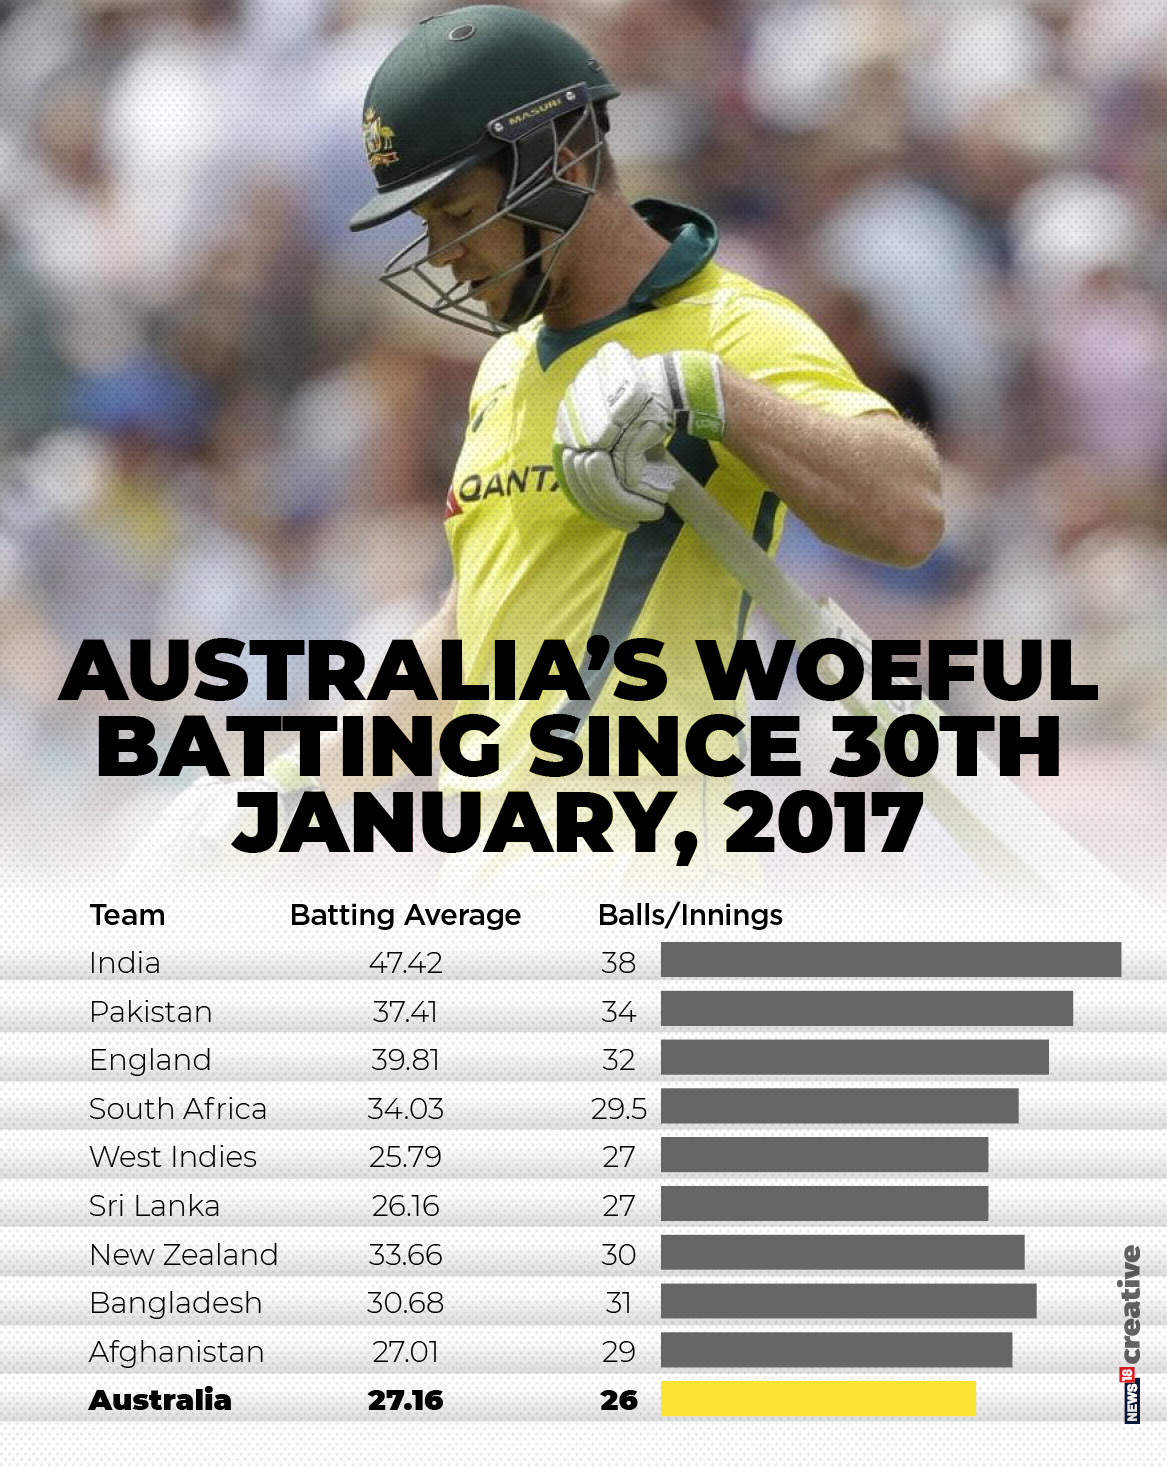
LOWEST BATTING AVERAGE
Australia’s combined batting average of 27.16 is the eighth-lowest since January, 2017 after India (47.42), England (39.81), Pakistan (37.41), South Africa (34.03), New Zealand (33.66), Bangladesh (30.68) and even Scotland (30.35).
And this has been their bane. Their batsmen are not scoring enough runs. They are getting in and getting out and not getting the big scores and the partnerships.
Australia’s batsmen are not spending enough time at the crease. On an average, they have faced just 26 balls per innings – this is by far the lowest amongst all major teams in the world. The Indian batsmen have faced 38 balls per innings and are followed by Pakistan (34), England (32), Bangladesh (31) and New Zealand (30). Australia’s balls/innings is even lower than West Indies, Sri Lanka, Ireland, Afghanistan and even Hong Kong and Netherlands.
The direct consequence of not spending enough time at the crease is not enough big runs. Not surprising, Australia have registered just 9 hundreds and 22 fifties in 222 innings. India has scored 30 hundreds and 55 fifties, England (23, 52), South Africa (13, 37) and Bangladesh (12, 38) and Pakistan (12, 40).
Australia’s frequency of scoring a hundred (one every 2.55 matches) is way behind India (on every 1.53 matches) and England (one every 1.78 matches).
What is more worrying is their frequency of fifties – one every 1.04 matches. This is amongst the worst in the world. New Zealand score 1.39 fifties per match and are followed by Pakistan (1.29), England (1.27), Bangladesh (1.22) and India (1.20).
Australian batsmen have also hit a lower number of boundaries per match in this period (19.56) as compared to England (23.87), India (23.54), South Africa (21.74), New Zealand (20.93) and Sri Lanka (19.67).
OPENING AND MIDDLE ORDER PROBLEM
Australia have averaged only 40.69 for the opening wicket with just 2 hundred and 4 fifty stands. This pales into comparison with Pakistan (56.22), South Africa (53.58), India (50.86), England (46.07) and Sri Lanka (41.97).
Australia’s openers average just 36.91 in this period. That is approximately 24 runs per wicket behind India’s openers (60.12). Pakistan, Bangladesh, England and South Africa all have a higher openers’ average.
It is Australia’s 3, 4, 5 which has been their major cause of concern in this period. They average just 29.6 in this period. Just for perspective, the corresponding average for England is 51.80, India (50.84), New Zealand (45.27), Pakistan (43.76), South Africa (39.78), Bangladesh (34.54), Sri Lanka (30.19) and West Indies (30.06). Even Ireland (32.11), Afghanistan (32.07) and Zimbabwe (32.04) have been more productive from these batting positions.
Australia have scored just 3 hundreds and 9 fifties from Number 3, 4 and 5 during this period. The corresponding number for India is (12, 23), England (10, 29), New Zealand (8, 25) and South Africa (7, 18).
Occupation of crease is again the major concern – Number 3, 4 and 5, on an average, have only faced 33.28 balls per innings in this period. This is the lowest amongst all teams who have at least played 10 ODIs in this period – even lower than Sri Lanka (33.89), Bangladesh (37.18) and West Indies (38.42).
There have been several reasons for the failure of the Australia top and middle order during this period. Their down fall started after the 2015 World Cup with the retirement of some of their stalwarts – Michael Clarke, Shane Watson and Brad Haddin. James Faulkner who lent a good balance to the lower order became a fraction of the player he was before being dropped.
Chopping and changing of teams has also been another major reason for the instability of the top and middle order. Australia has tried 32 players during this period – in just 23 matches. West Indies have had a pool of 34 – in 37 matches and Sri Lanka 41 in 45 matches. In fact, Australia is the only team whose total players exceed total number of matches in this period!
Another major reason has been the focus on Test cricket since the Ashes loss at home in 2010-11. While that has brought rich dividends to Australia in Test cricket, where they are still a force to be reckoned with (Australia is at number two in win-loss ratio in Tests since 1st Jan, 2015) – and have not lost a home Ashes since 2010-11 – it is their form in ODI cricket which has suffered over the last three years.
The absence of two key batsmen – David Warner and Steven Smith – has also accentuated the downfall – but their fortunes had started dwindling even with the two modern greats in the side.
THE WARNER-SMITH FACTOR
Warner and Smith were amongst the premier batsmen in world cricket between the 1st of January, 2015 till the end of the home series against Pakistan in January, 2017.
No batsman had scored more runs than Warner and only AB de Villiers averaged (67.91) more than the Australian opener (61.71) in this time-frame. Smith also aggregated above 2000 and averaged above 50 during this period.
But thereafter, till they were banned for ball-tampering, they had a major slump in ODI cricket in the 13 innings they played for Australia.
Warner scored just 397 runs at an average of 33.08 with just one hundred and fifty. And Smith aggregated 330 at an average of 30 (and strike rate of 75.34) with no hundreds and three fifties.
So, although it can be argued that they were both going through a rough patch and unfortunately for Australia, simultaneously – and would have bounced back had they not been served the ban - the fact is that the downfall had started with both very much a part of the team.
Injuries to fast bowlers and poor selection has also contributed to Australia’s ODI misery. It is not surprising then that Warner, Smith, Finch, Cummins, Hazlewood and Starc – six genuine match-winners in the side – have only played 8 matches together in their career!
BOWLING ISSUES
With the likes of Hazlewood, Starc and Cummins amongst their ranks, Australia’s fast bowling should rank amongst the best in the world. But that has not been the case in the last couple of years. Again, injuries and inconsistent selection has meant that the trio have played just 11, 12 and 16 matches since the Chappell-Hadlee Trophy in January, 2017. And only 9 matches together.
This has resulted in average returns from their fast bowling resources. Australia’s fast-bowling unit average 34.12 since January, 2017 – amongst the worst in world cricket. Even Bangladesh have a better fast bowling average. Their economy of 5.69 runs per over is also the worst barring Sri Lanka and West Indies.
The lack of a decent spinner is also hurting Australia’s ODI team. Aussie spinners have only accounted for 17 wickets in the last couple of years. They have the worst bowling average (87.94), worst economy rate (5.94) and worst bowling strike rate (88.7) amongst all teams in this time-frame.
Australia are currently ranked at number six in the ICC ODI Rankings – their lowest in 34 years. It might take more than just the return of Warner and Smith to get them out of this slump and become contenders for the World Cup in 2019.
Related Story
 Miller, Du Plessis Tons Ensure South Africa Series Win in Australia
 Australian Team 'Drained by Noise' Despite Leveling South Africa Series: Stoinis
 Steve Smith and David Warner Play Together For the First Time in Australia Since Ban
First Published: November 13, 2018, 10:45 AM IST


 Live TV