Rupee, crude, earnings to keep St on toes

Stock markets

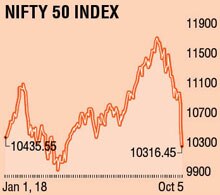
The equity market witnessed the worst week in last two years previous week as the indices tumbled like a pack of cards. The Nifty plunged 5.62% last week and closed at the lowest level of 10316. Markets were nervous throughout the week and faced selling pressure backed by foreign institutional investors (FII) relentless selling in equities. The falling rupee and rising crude price added more to this pain. The mid and small cap indices lost 5% and 4% respectively.
Sector-wise, all the sectors ended in the red. The Bank Nifty outperformed the index which lost 2.70%. The notable historic underperformance was from seen in the Energy sector lead by OMCs which were down by 23-35% in last week and index heavyweight Reliance Industries and ONGC also lost 16.50% each. In rest of the sectors, FMCG lost 6.3%, Pharma was down by 4.25% and Metals were least affected though lost 1.10%.
The FIIs sold equities worth Rs 9,185 crore while the domestic institutional investors (DII) were buyers to the tune of Rs 6,933 crore in the last short week.
 In the last week highlights, on Thursday the finance minister announced cut in central excise duty on fuel by Rs 1.50/ltr and asked oil marketing companies (OMC) to bear Rs 1/ltr as a subsidy. The government proposed to all states to take a cut in duties of Rs 2.5/ltr which caused panic selling across the Oil and Gas sector stocks as the investors feared to return of subsidy era, OMCs faced landslide effect and were crashed down by 20% in no time.
On Friday, the Reserve Bank of India (RBI) in its policy meeting surprised the market by keeping rates unchanged but changed its stance from neutral to calibrated and maintained FY19 GDP growth estimate at 7.4%. This along with fuel subsidy triggered panic button and Nifty reacted to slide further in last closing hour session. The rupee crashed to its new historical low of 74.10 on Friday and finally settled at 73.77 due to the twin impact of capital outflows from equity and debt markets as the bond yield in the US rose to 3.25%.
In the key global event this week includes China September month Trade Balance which will be released on Thursday. However, the US markets are closed today. India Industrial and Manufacturing production for August month and September month CPI will be released on Friday. Q2'19 corporate earnings season will commence from this week.
For the week, the market will take cues from the rupee and crude prices movement as well as global markets trend. Nifty took five months to reach to the peak level of 11760 in August month from its April'18 level of 10300 and retraced to 10300 on last Friday which took just one month which reminds me the law of Gravity. Technically, on daily charts, Nifty made a "Three Black Crow" pattern, on the weekly scale it formed Bearish candle for the fifth week which indicate bearishness still persists. For the week, Nifty support levels 10180-10100-9950 while resistance levels 10450-10550-10600.
SLIDESHOW MAY PERSIST
- Technically, on daily charts, Nifty made a "Three Black Crow" pattern, on the weekly scale it formed Bearish candle for the fifth week which indicate bearishness still persists
- Nifty took five months to reach to the peak level of 11760 in August month from its April'18 level of 10300 and retraced to 10300 on last Friday
The writer is VP-retail research, Motilal Oswal Financial Services