

U.S. hotel food-and-beverage revenue per occupied room (F&B RevPOR) increased 1.6% in 2017, according to total-year data from STR.
F&B RevPOR reached US$105.56, up from US$103.93 in 2016. This growth reflected increases across all hotel classes and contributions from both food and beverage revenue sources.
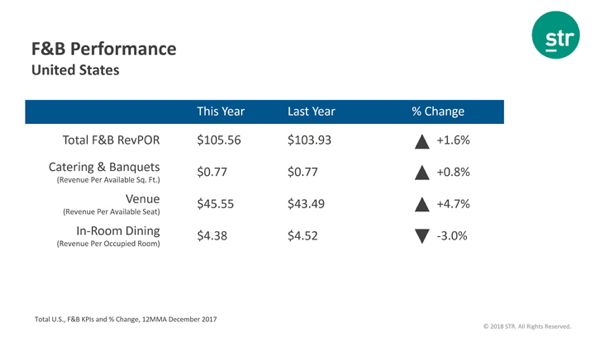
Among F&B department revenue centers, hotel venue operations experienced the most significant percent change from 2016 with a 4.7% increase in revenue per available seat.
“Innovation and concept changes had a positive impact on hotel F&B results in 2017, particularly with creative use of space for venue operations,” said Veronica Andrews, STR’s director of digital data solutions.
“We know that as catering-and-banquets performance goes, so goes the F&B department,” Andrews said. “With an industry average of 25,000 square feet of meeting space per property reporting to STR, that 0.8% increase represents substantial revenues from hosted events in hotels and resorts across the country.”
In-Room Dining RevPOR was down 3.0%, but Andrews noted that the decrease does not indicate a shift in focus away from this operation.

“In-room dining results reflect a myriad of changes in deliverables and brand standards,” Andrews said. “We don’t assume that managers have walked away from that revenue opportunity. The focus is on improving profitability and guest satisfaction in this area. In some cases, non-discretionary service charges give way to ‘grab-n-go’ or marketplace operations or other alternative in-room dining options. We also should keep in mind that in-room dining, as a revenue center, is the smallest revenue-generating operation in the F&B department.”
Among major markets, F&B performance decreases were common as Group business in the combined Luxury and Upper Upscale hotel segments declined. Of note, the Atlanta, Chicago and Miami markets experienced a decrease in all Group segment key performance indicators—room night demand, rooms revenue and catering-and-banquets RevPAS.
Bucking the national trend, Washington, D.C. posted a 0.8% increase in catering-and-banquets RevPAS on top of a 6.1% rise in Group room revenue. Additionally, Dallas Group room revenue and catering-and-banquets spend was up from the prior year even while Group room night demand fell.
STR provides clients from multiple market sectors with premium, global data benchmarking, analytics and marketplace insights. Founded in 1985, STR maintains a presence in 10 countries around the world with a corporate North American headquarters in Hendersonville, Tennessee, and an international headquarters in London, England. For more information, please visit str.com.
Logos, product and company names mentioned are the property of their respective owners.