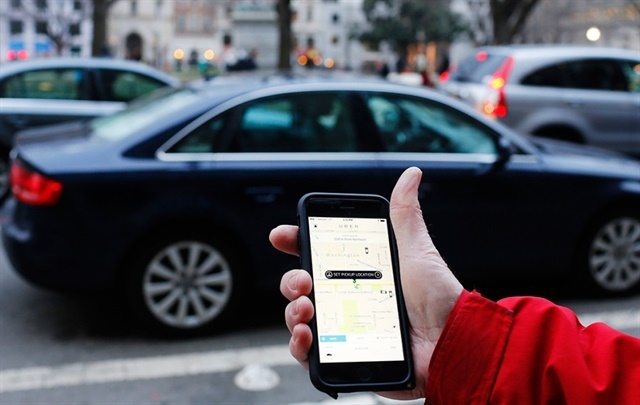
Photo via Mark Warner/Flickr
 |
Automated travel and entertainment expense management software provider, Certify, announced the results of its fifth, full-year SpendSmart Report with analysis of U.S. business travel and expense spending trends for 2017.
The Certify SpendSmart report tracks business travel expense spending across major categories such as food, airlines, lodging, and car rental. The data is collated based on transaction volume, not overall revenue in each category.
Compared to 2016, ride hailing accounted for 68% of the overall transaction volume in the ground transportation category last year led by Uber and rival Lyft, respectively with 56% and 12% of the total.
Elsewhere in the category, taxi held a 7% share of 2017 rides, down from 11% in 2016, and car rental lost 8% share of ground transportation transaction volume over the last four quarters to end the year at 25%.
Uber also claimed 9% of all expenses and receipts processed by Certify in 2017, a 3% increase over last year and 6% more than second place Starbucks.
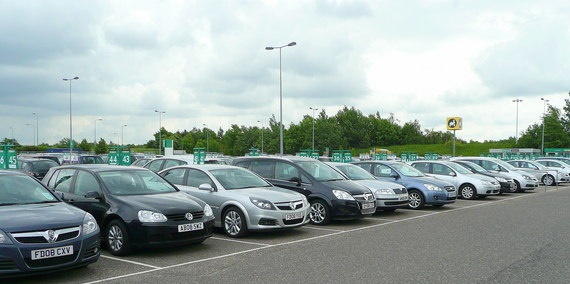
Photo via Geograph.org.uk/Wikimedia
 |
The Certify SpendSmart report tracks business travel expense spending across major categories such as food, airlines, lodging, and car rental. The report highlights top vendors and emerging trends with analysis of data from millions of expenses and receipts processed through the Certify system.
In car-rental specific categories, National Car Rental was the most expensed and top-rated brand in 2017, according to Certify data.
Most Expensed Car-Rental Services
- National: 27.10%, averaging $185.61
- Enterprise: 16.43%, averaging $199.17
- Hertz: 13.95%, averaging $195.12
- Avis: 11.97%, averaging $178.02
- Budget: 3.72%, averaging $187.25
Top Rated Car-Rental Services
- National: 4.4
- Enterprise: 4.3
- Hertz: 4.1
- Avis: 4.0
- Budget: 3.8
2017 T&E Expense Category Breakdown (% of total spending, benchmark average)
- Meals 19%, averaging $31.48
- Airfare 15%, averaging $318.74
- Hotel 13%, averaging $250.09
- Misc. 15%, averaging $71.19
- Fuel 19%, averaging $46.90
- Taxi 1%, averaging $38.48
- Cell Phone 4%, averaging $51.71
- Car Rental 5%, averaging $190.37
- Supplies 3%, averaging $65.88
- Shipping 2%, averaging $103.66
- Tolls 1%, averaging $31.74
- Parking 4%, averaging $106.08