Steer clear! MACD charts show these 50 stocks are going to crack
, ETMarkets.com|
Updated: Nov 07, 2017, 03.51 PM IST

NEW DELHI: As NSE’s Nifty50 index closed flat on Monday, the momentum indicator moving average convergence divergence, or MACD, signalled downward crossovers on 50 stock counters on the bourse.
MACD is known for identifying trend reversals.
The stocks that saw bearish crossovers included Vedanta, Reliance Industries, Sun Pharma, Sterlite Technologies, Exide Industries, Mawana Sugars, Lupin, Deepak Fertilisers, SML Isuzu, Quess Corp and Andhra Cement.
Some of these counters also witnessed strong volumes, adding further credibility to the emerging trend. Other stocks that saw bearish crossovers included India Cements, Dhampur Sugar, Bata India, NIIT Technologies and Linc Pen.
MACD is a trend-following momentum indicator, and is the difference between the 26-day and 12-day exponential moving averages. A nine-day exponential moving average, called the ‘signal’ line, is plotted on top of the MACD to reflect ‘buy’ or ‘sell’ opportunities.
When the MACD falls below the signal line, it gives a bearish signal on the charts, indicating that the price of the security may experience a downturn, and vice versa.

However, the MACD alone may not be sufficient to help take an investment call.
Traders should make use other indicators such as Relative Strength Index (RSI), Bollinger Bands, Fibonacci Series, candlestick patterns and Stochastic to confirm such trend.
Retail investors should consult a financial expert before buying or selling a stock based on such technical indicators.
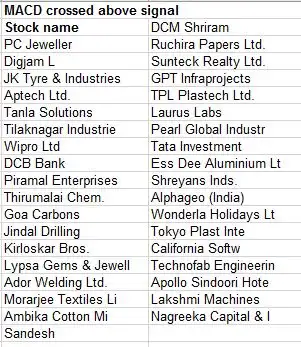
The MACD charts also showed bullish crossovers on 36 counters on NSE, meaning a ‘buy’ signal. They included PC Jewellers, DCB Bank, Jindal Drilling, Wipro, Goa Carbons, Ess Dee Aluminium and Laurus Labs.

The 50-share Nifty index settled 0.70 points, or 0.01 per cent, down at 10,451 on Monday, while the BSE Sensex ended 45.63 points, or 0.14 per cent, up at 33,731.
Since last four trading sessions, the Nifty has been consolidating within the 10,470-10,380 band, representing near-term sideways trend, says Rajesh Palviya, Head of Technical & Derivatives, Axis Securities.
Last week, the Nifty50 formed a bullish gap area in the 10,367-10,385 range, which is likely to act as support for any minor corrective action in the near term. Any violation of this support zone on a closing basis will cause further correction towards 10,330-10,300 levels. However any move above 10,470 will accelerate buying in the market and the Nifty can scale the 10,530-10,550 levels, he said.
Understanding MACD

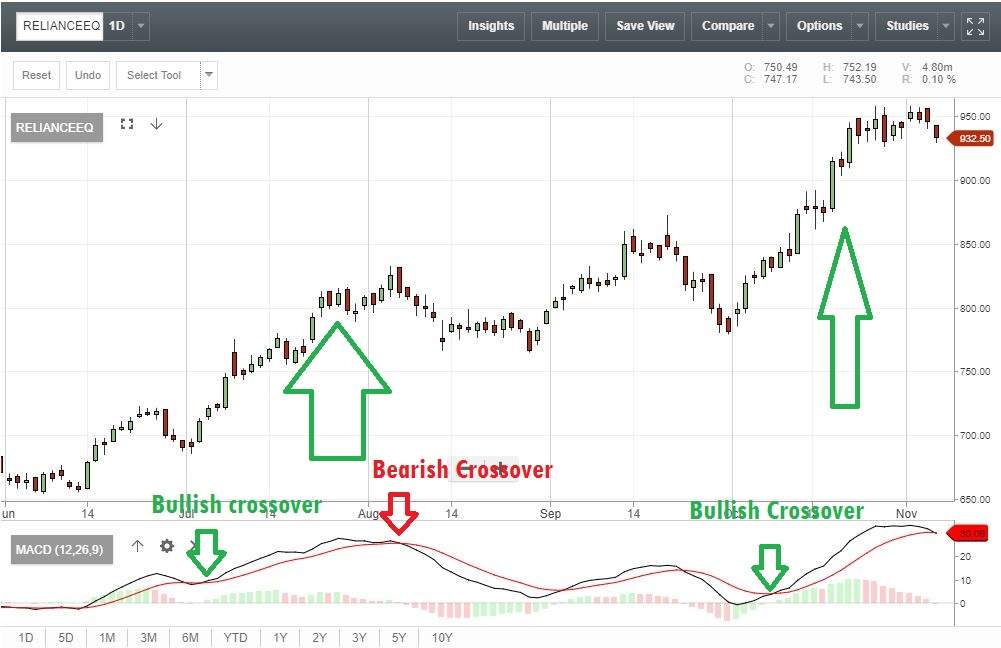
A close look at the chart of Reliance Industries shows whenever the MACD line has crossed above the signal line, the stock has always shown an upward momentum. Shares of the company closed 1.18 per cent down at Rs 934.45 on November 6.
MACD is known for identifying trend reversals.
The stocks that saw bearish crossovers included Vedanta, Reliance Industries, Sun Pharma, Sterlite Technologies, Exide Industries, Mawana Sugars, Lupin, Deepak Fertilisers, SML Isuzu, Quess Corp and Andhra Cement.
Some of these counters also witnessed strong volumes, adding further credibility to the emerging trend. Other stocks that saw bearish crossovers included India Cements, Dhampur Sugar, Bata India, NIIT Technologies and Linc Pen.
MACD is a trend-following momentum indicator, and is the difference between the 26-day and 12-day exponential moving averages. A nine-day exponential moving average, called the ‘signal’ line, is plotted on top of the MACD to reflect ‘buy’ or ‘sell’ opportunities.
When the MACD falls below the signal line, it gives a bearish signal on the charts, indicating that the price of the security may experience a downturn, and vice versa.

However, the MACD alone may not be sufficient to help take an investment call.
Traders should make use other indicators such as Relative Strength Index (RSI), Bollinger Bands, Fibonacci Series, candlestick patterns and Stochastic to confirm such trend.
Retail investors should consult a financial expert before buying or selling a stock based on such technical indicators.
The MACD charts also showed bullish crossovers on 36 counters on NSE, meaning a ‘buy’ signal. They included PC Jewellers, DCB Bank, Jindal Drilling, Wipro, Goa Carbons, Ess Dee Aluminium and Laurus Labs.

The 50-share Nifty index settled 0.70 points, or 0.01 per cent, down at 10,451 on Monday, while the BSE Sensex ended 45.63 points, or 0.14 per cent, up at 33,731.
Since last four trading sessions, the Nifty has been consolidating within the 10,470-10,380 band, representing near-term sideways trend, says Rajesh Palviya, Head of Technical & Derivatives, Axis Securities.
Last week, the Nifty50 formed a bullish gap area in the 10,367-10,385 range, which is likely to act as support for any minor corrective action in the near term. Any violation of this support zone on a closing basis will cause further correction towards 10,330-10,300 levels. However any move above 10,470 will accelerate buying in the market and the Nifty can scale the 10,530-10,550 levels, he said.
Understanding MACD

A close look at the chart of Reliance Industries shows whenever the MACD line has crossed above the signal line, the stock has always shown an upward momentum. Shares of the company closed 1.18 per cent down at Rs 934.45 on November 6.


